Rancher Pod Metrics 部分 Panel No data 问题排查
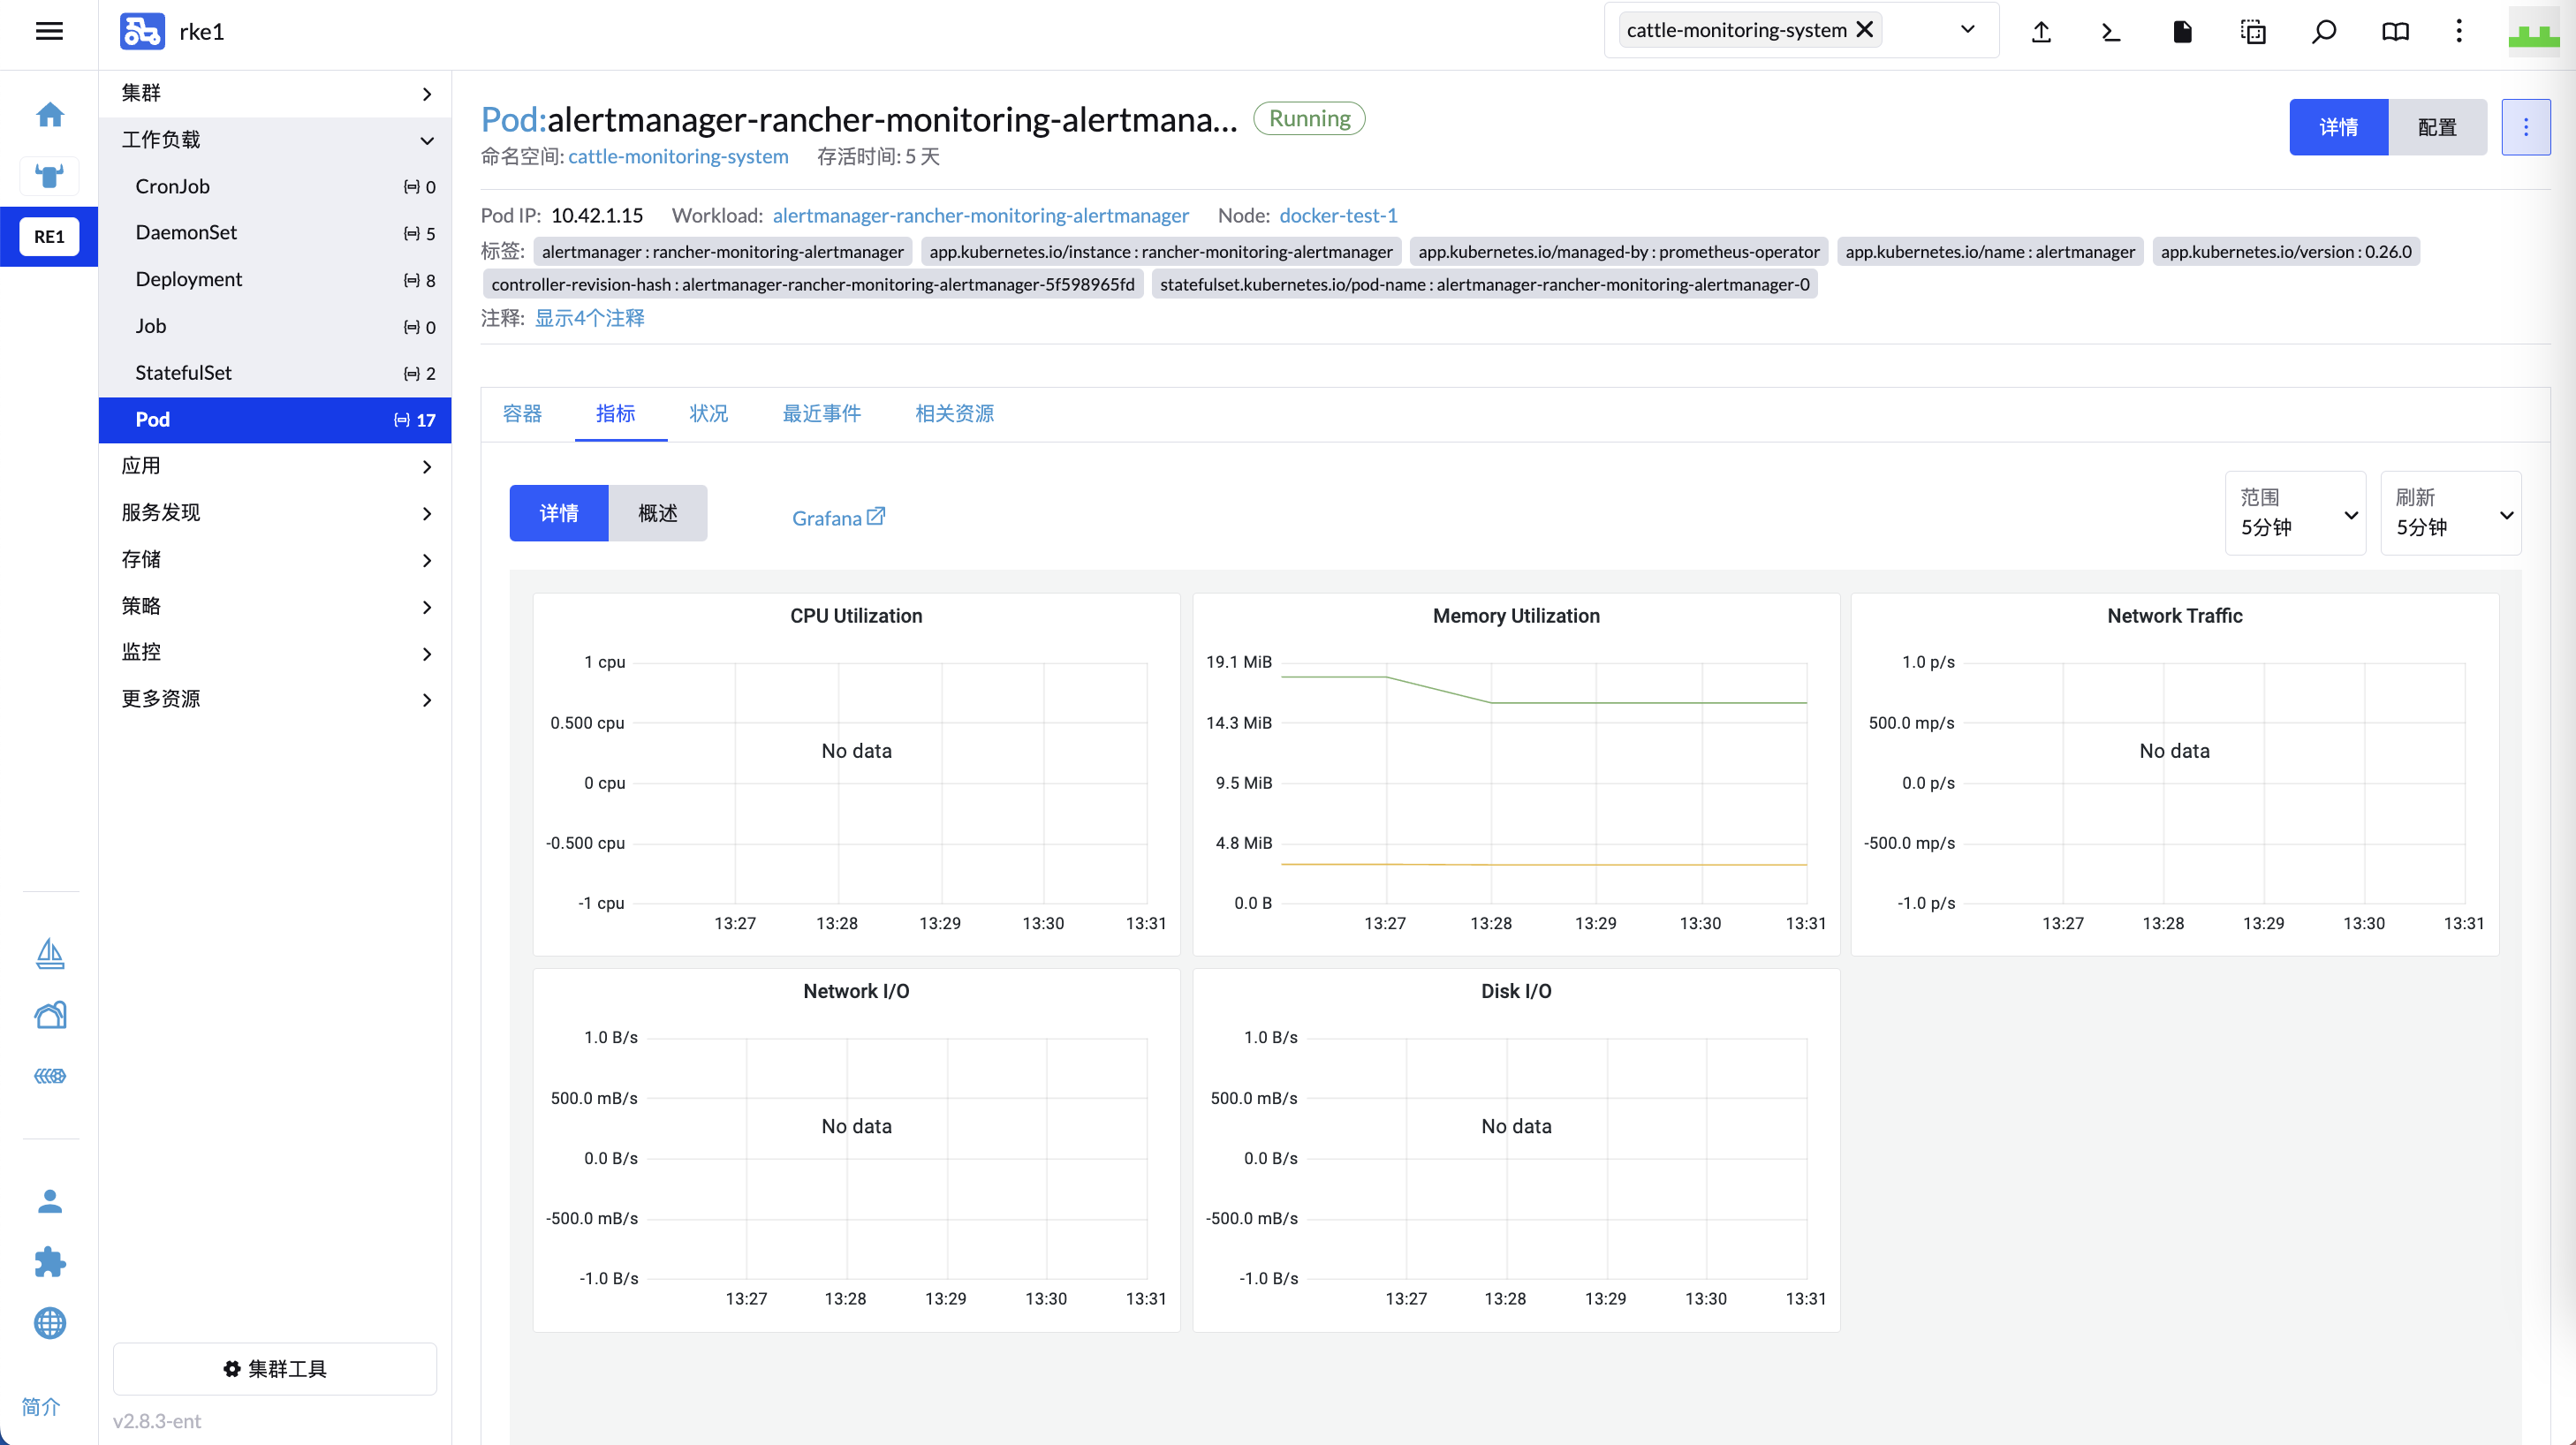
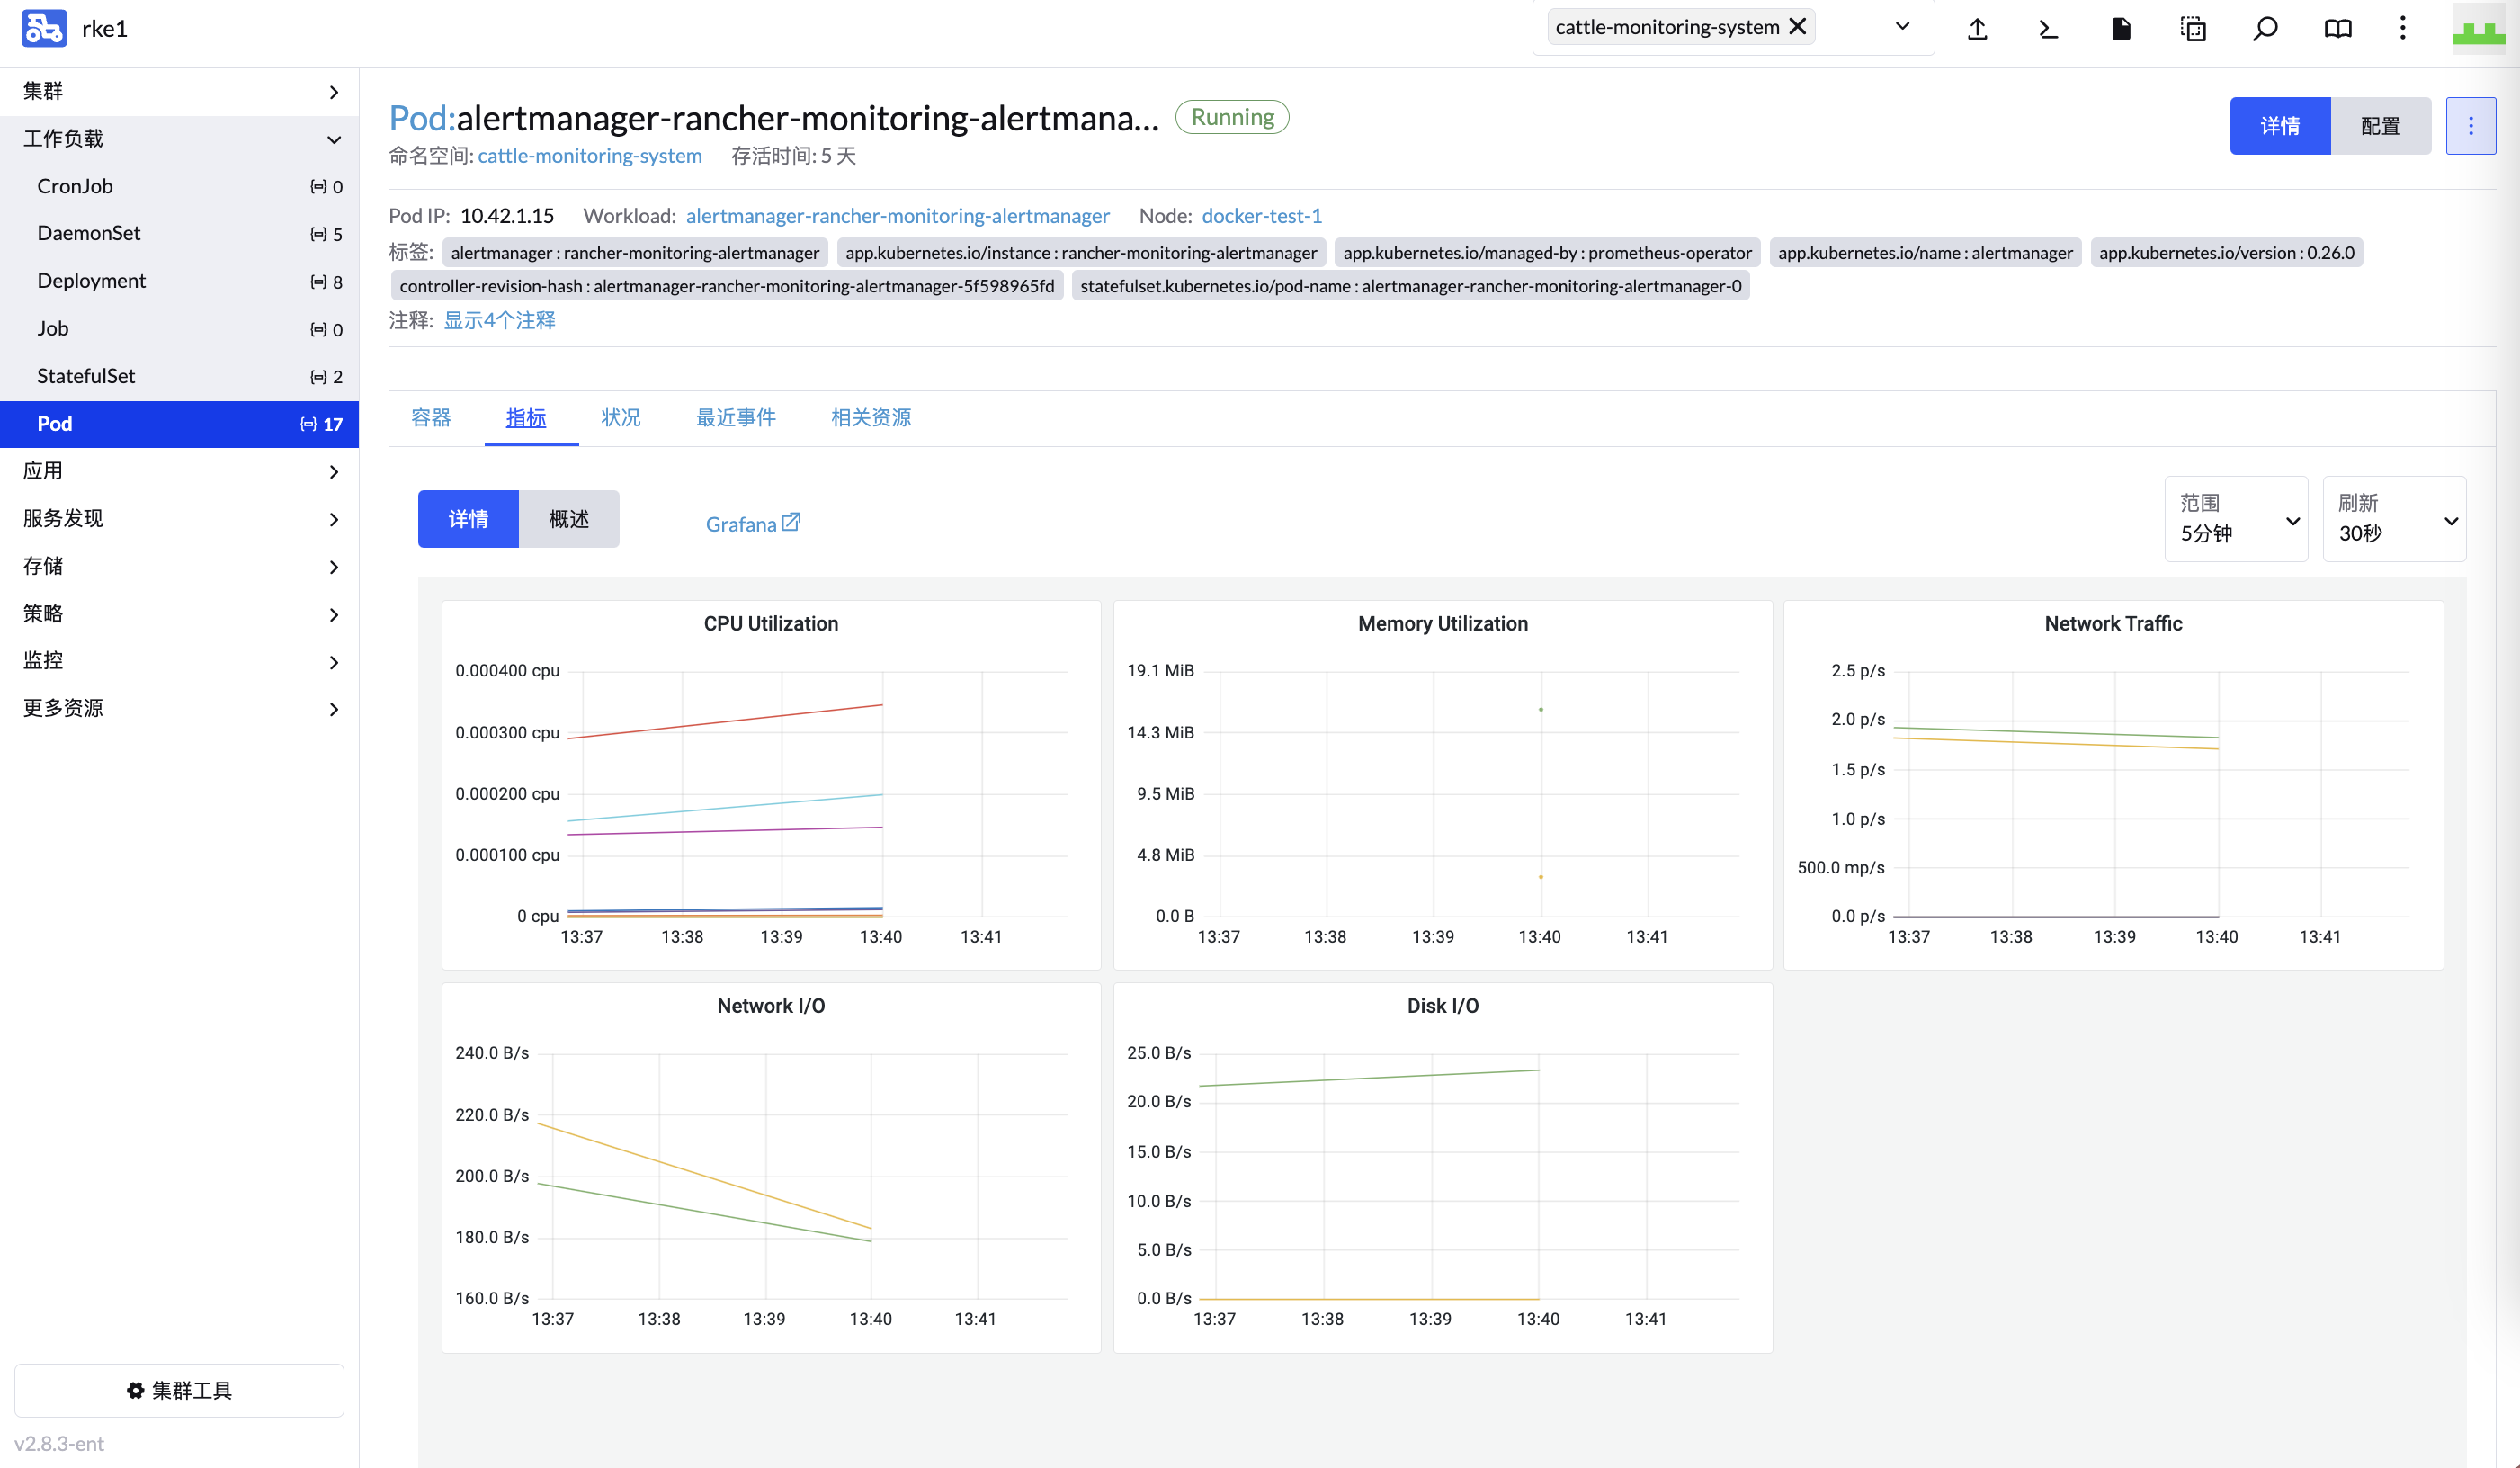
Rancher Pod Metrics 有部分 Panel 显示 No data,只有 Memory Utilization 显示正常:
最初检测了 Prometheus、Prometheus Targets、Grafana 等,都没有异常,直接查询也是有数据的。
后来检查了 cattle-dashboards namespace 下的 rancher-default-dashboards-pods ConfigMap,发现除了 Memory Utilization 之外,其他 Panel 的 PromQL 都使用了 __rate_interval,这个是 Grafana 7.2 引入的新变量,用于 Prometheus 的 rate 查询。
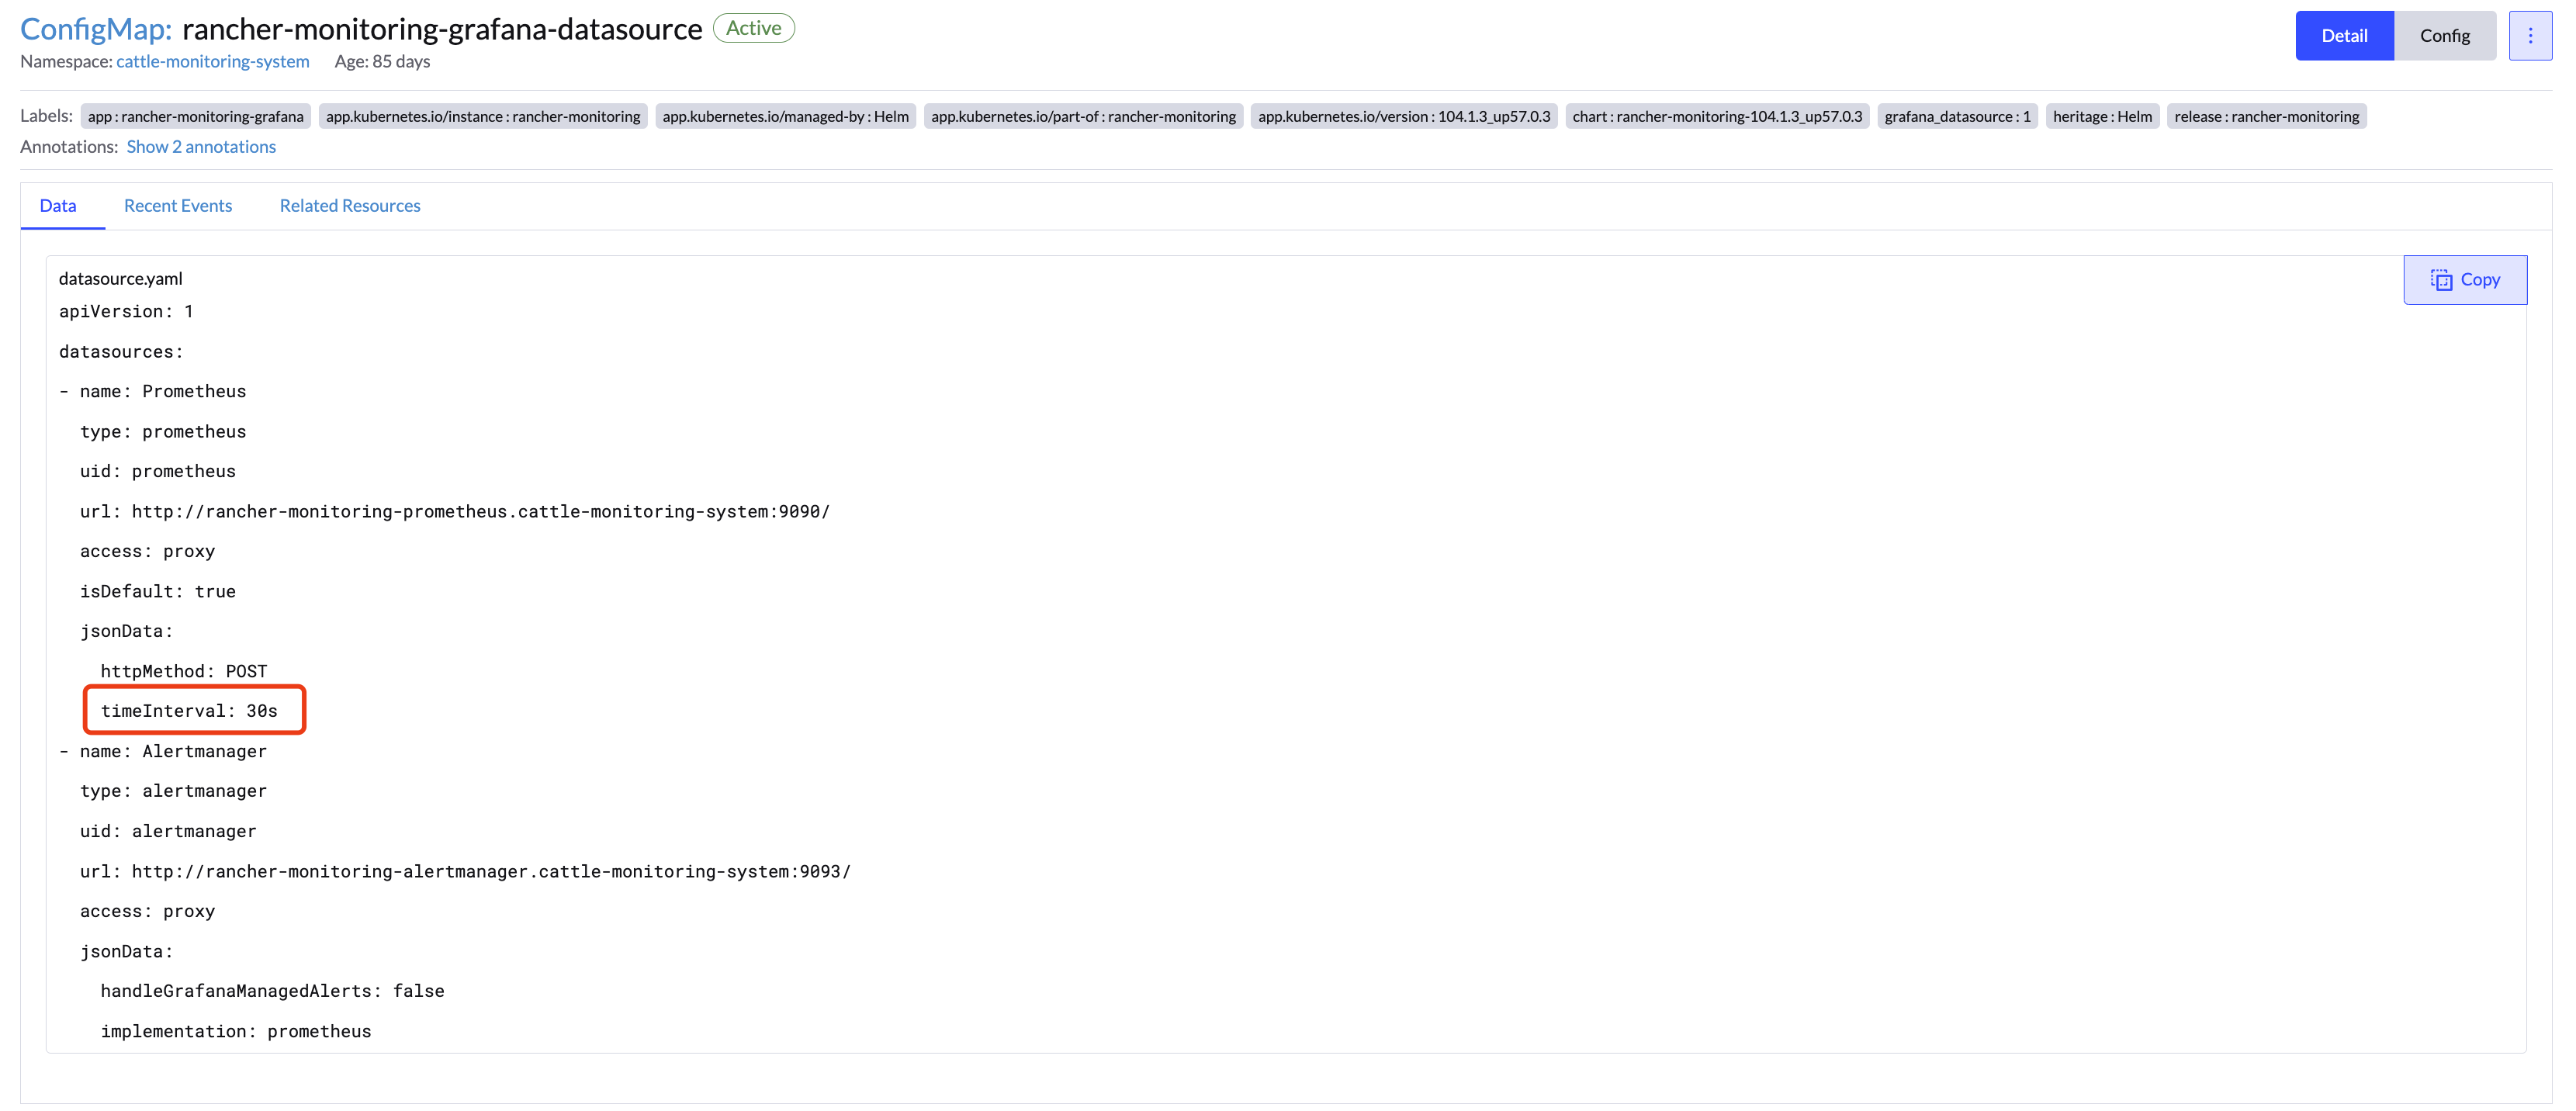
根据文档的解释,__rate_interval 依赖于 Prometheus scrape_interval 而进行计算,这个值在 Grafana 的数据源界面可以看到,Rancher Monitoring Grafana 的默认数据源配置是在 cattle-monitoring-system 的 rancher-monitoring-grafana-datasource ConfigMap,可以看到 timeInterval 为 30s:
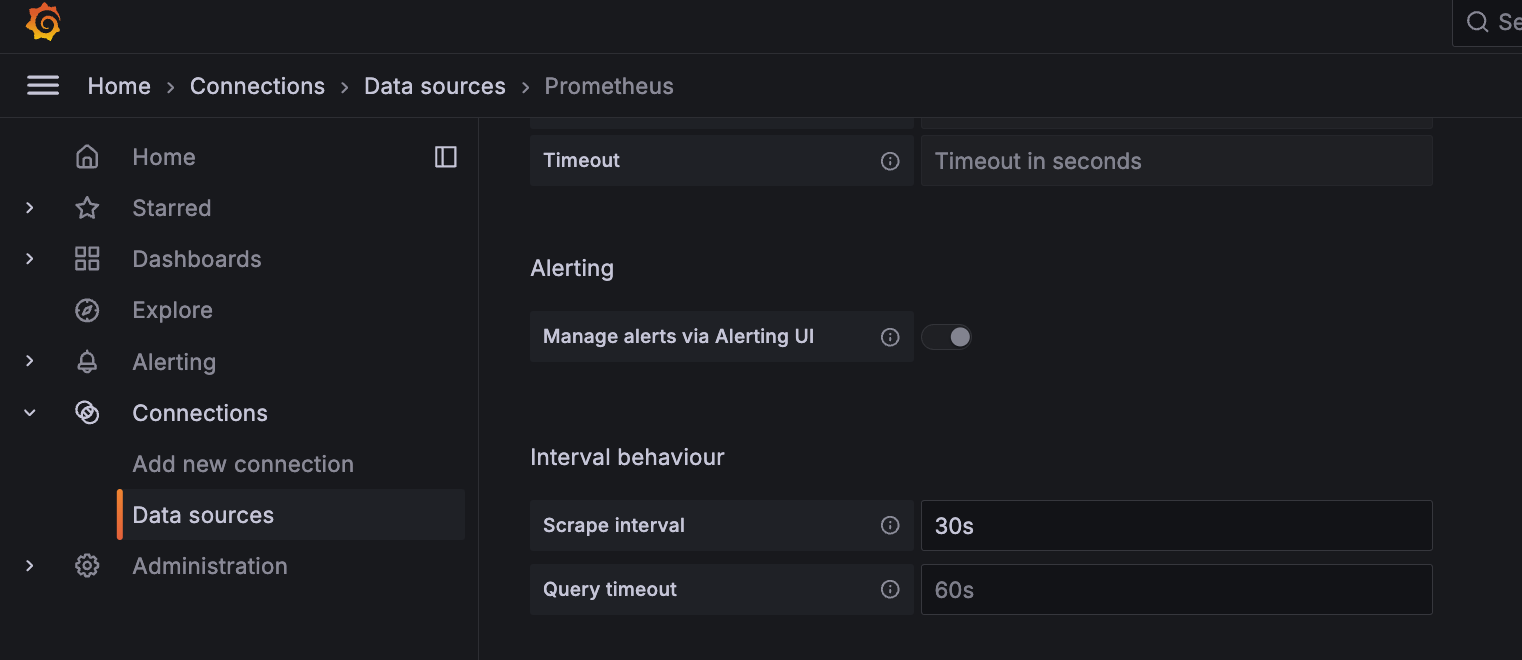
与 Grafana 数据源界面中的 Scrape Interval 相同:
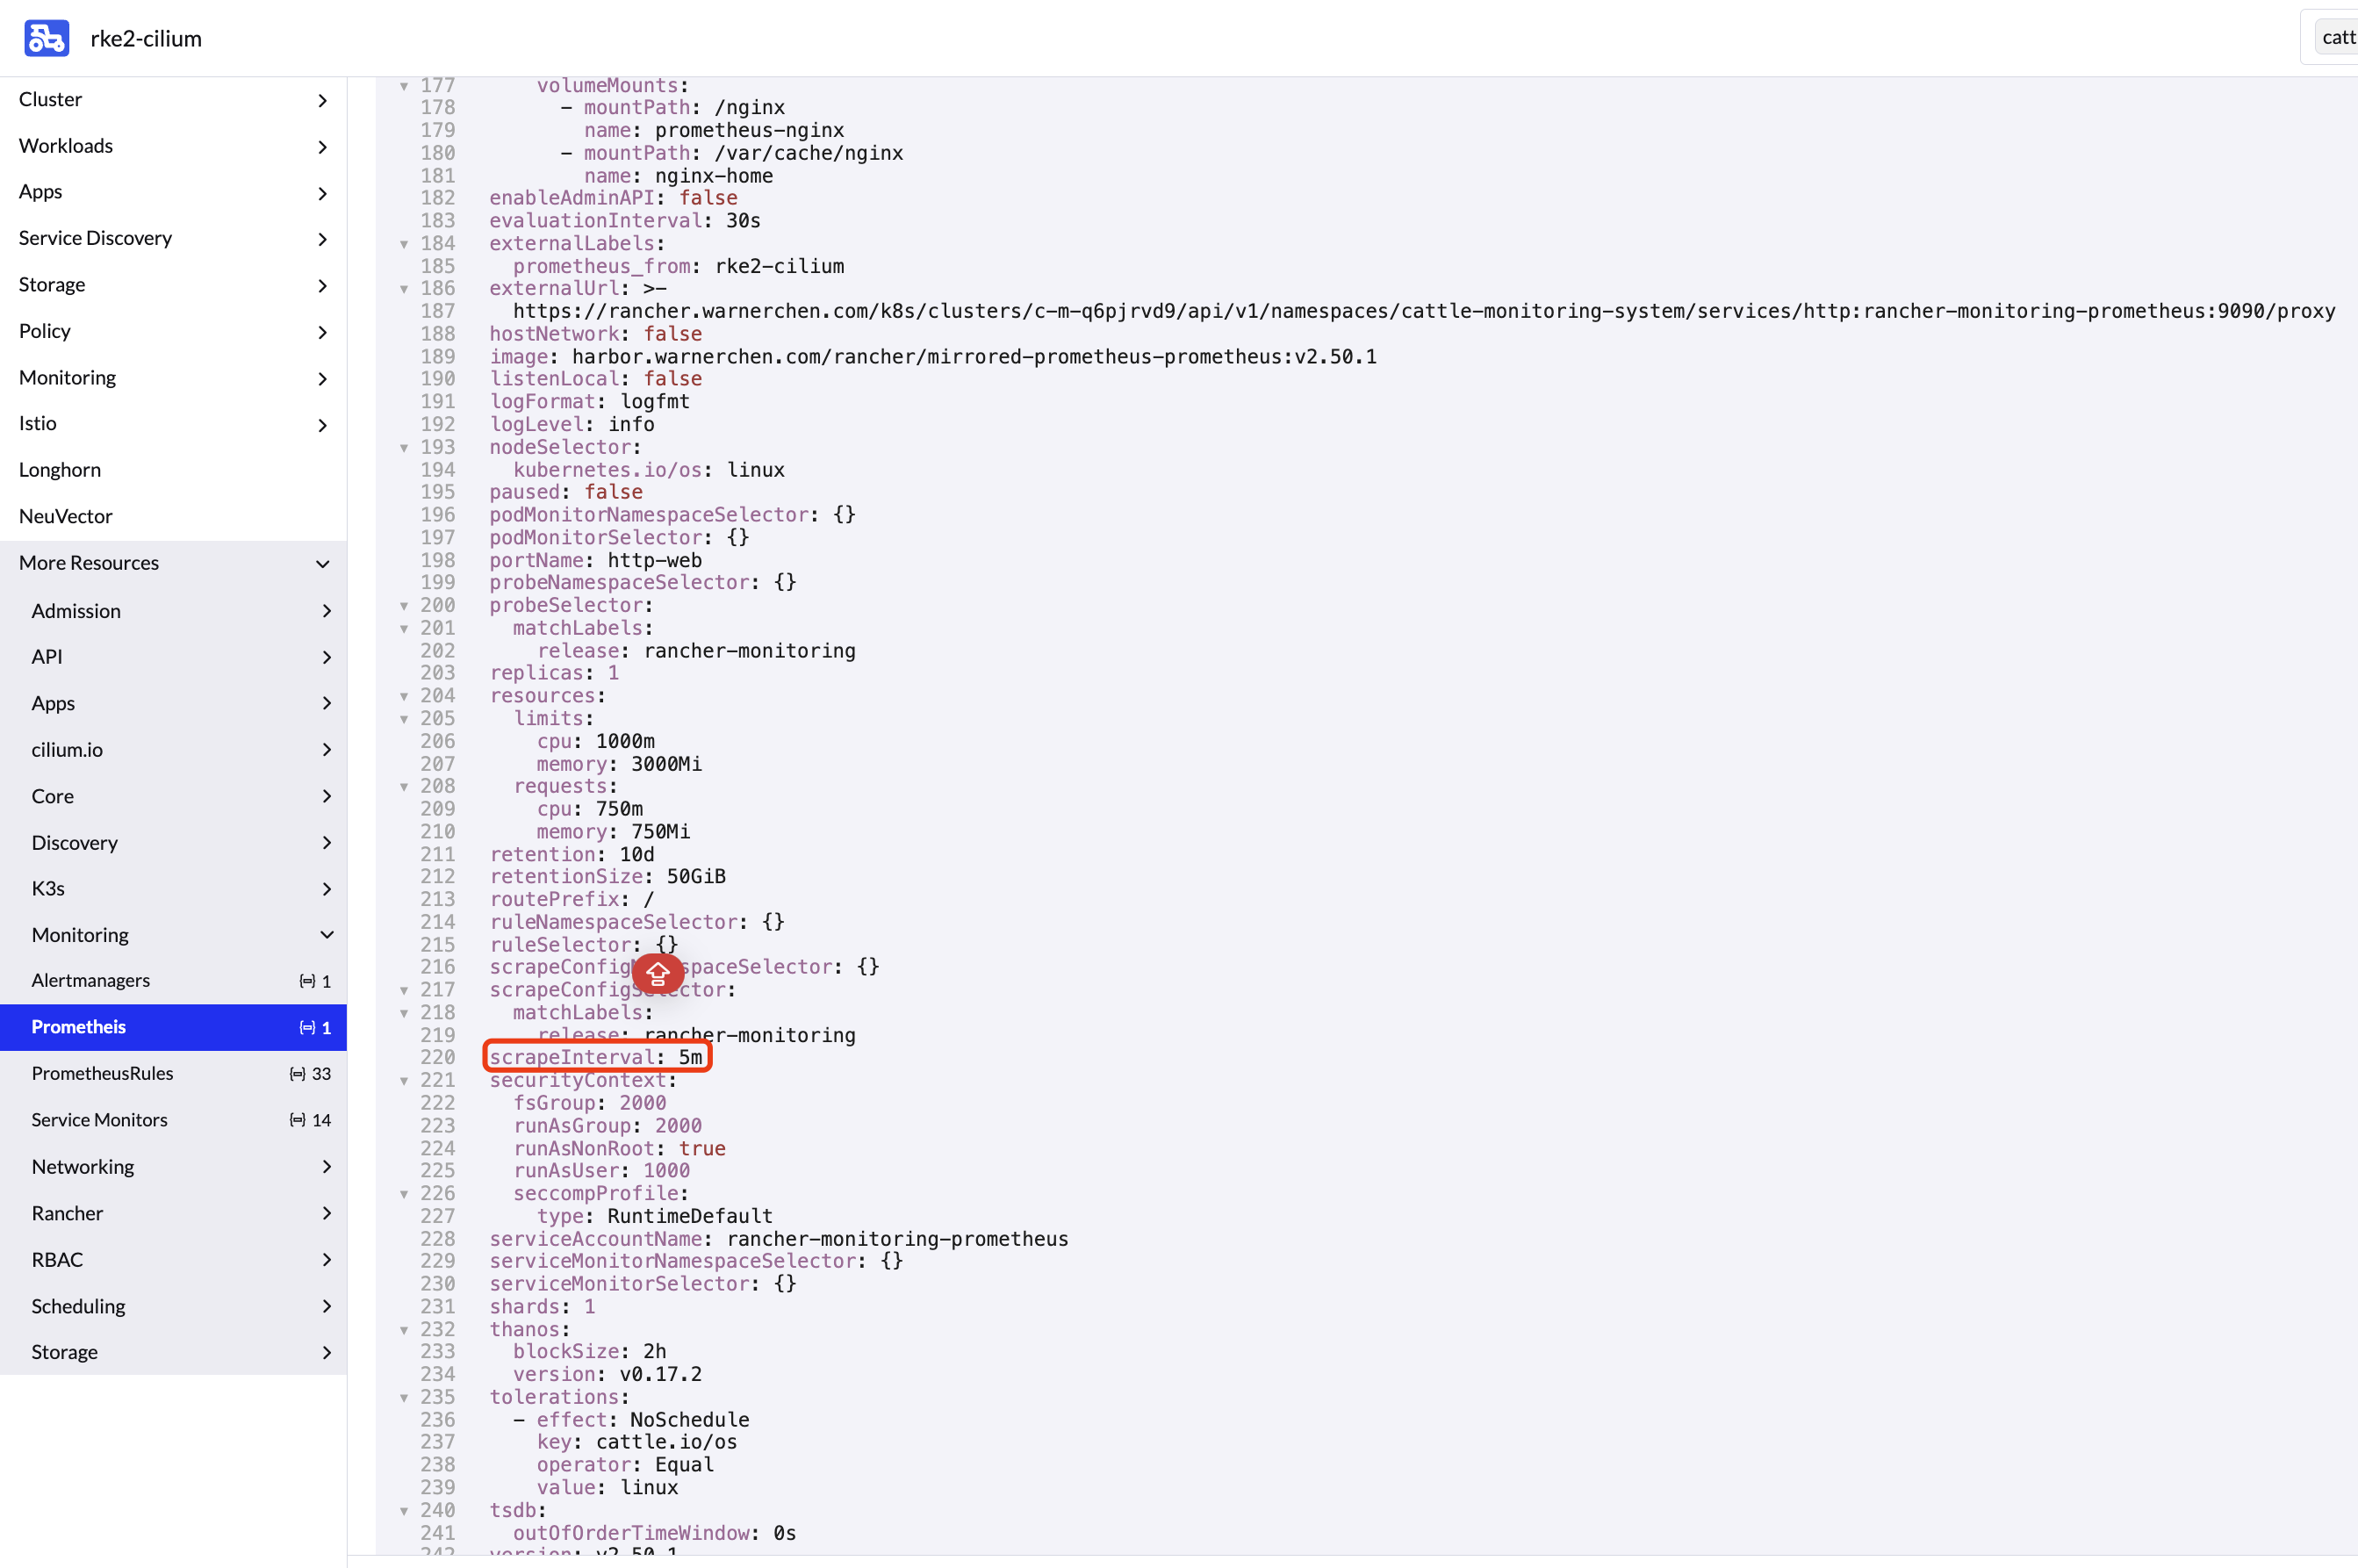
再去检查 Prometheus 的配置,发现 scrape_interval 为 5m,与默认的 30s 不一致:
所以针对这个问题有两个解法:
- 修改 cattle-monitoring-system 的 rancher-monitoring-grafana-datasource ConfigMap,将
timeInterval改为 5m。 - 修改 Prometheus 的
scrape_interval回 30s。
修改后问题解决:
Rancher Pod Metrics 部分 Panel No data 问题排查
https://warnerchen.github.io/2025/02/08/Rancher-Pod-Metrics-部分-Panel-No-data-问题排查/
install_url to use ShareThis. Please set it in _config.yml.