通过 Target Allocator 收集 Service/Pod Monitor Metrics
场景:SUSE O11y Agent 默认不会收集 Service/Pod Monitor 获取的 Metrics,最简单的方法是通过 Prometheus remote write 的方式将这些 Metrics 传输到 SUSE O11y Server 的 VictoriaMetrics。但集群中共同存在 Prometheus 和 VictoriaMetrics 很耗费资源,这时候可以借助 Open Telemetry 的 Target Allocator 能力,代替 Prometheus 收集这些指标。
参考文档:
- https://github.com/open-telemetry/opentelemetry-operator/blob/main/cmd/otel-allocator/README.md#target-allocator
- https://opentelemetry.io/docs/platforms/kubernetes/operator/troubleshooting/target-allocator/
首先需要在集群安装 Open Telemetry Operator,参考文档:https://documentation.suse.com/cloudnative/suse-observability/latest/en/setup/otel/getting-started/getting-started-k8s-operator.html
创建 TA 使用的 RBAC:
1 | cat <<EOF | kubectl apply -f - |
部署 Open Telemetry Collector,需要注意 mode 要为 statefulset/daemonset,参考文档:https://documentation.suse.com/cloudnative/suse-observability/latest/en/setup/otel/getting-started/getting-started-k8s-operator.html#_the_open_telemetry_collector
1 | kubectl create namespace open-telemetry |
1 | cat <<EOF | kubectl apply -f - |
完成部署后,检查 Pod 运行情况:
1 | root@test-1:~# kubectl -n open-telemetry get pod |
此时集群中如果有 Pod/Service Monitor 的话,TA 便会自动获取,日志如下
1 | {"level":"info","ts":"2025-05-15T07:46:43Z","msg":"Starting the Target Allocator"} |
Open Telemetry Collector 日志如下:
1 | ... |
也可以通过调用 TA 的接口,检查是否有发现 Pod/Service Monitor:
1 | root@test-1:~# curl -s <otel-collector-targetallocator_cluster_ip>/jobs | jq |
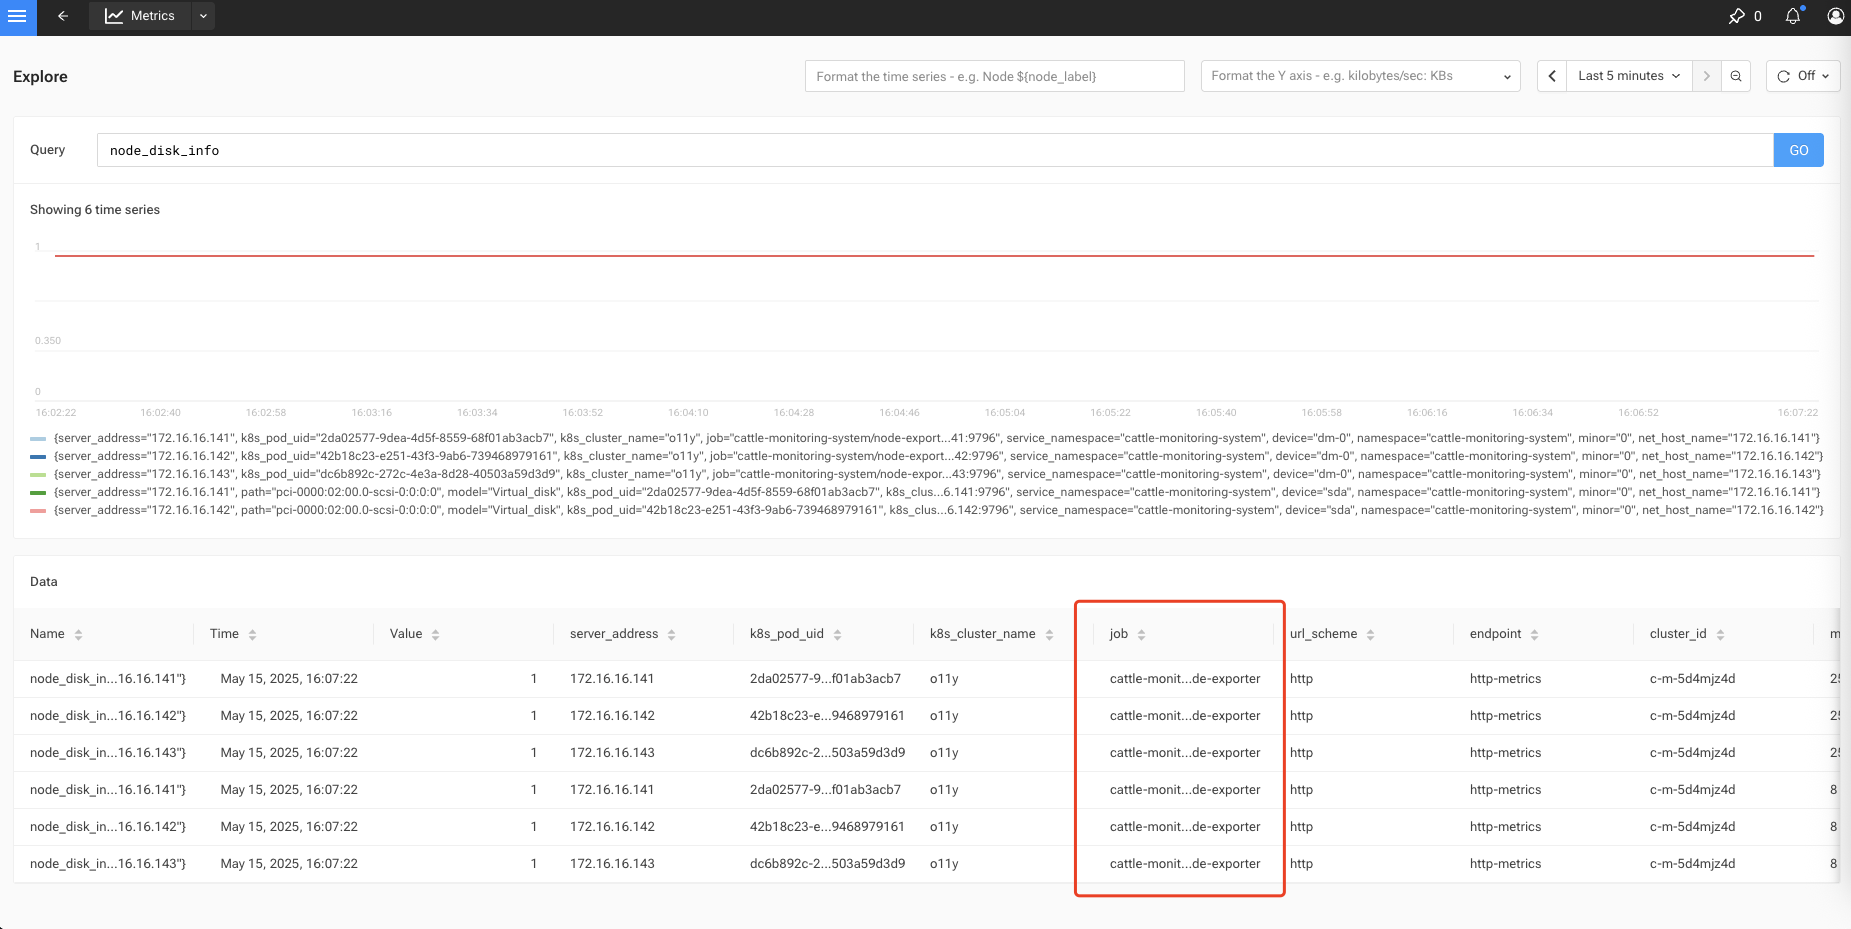
随后即可在 SUSE O11y 搜索这些 Metrics:
通过 Target Allocator 收集 Service/Pod Monitor Metrics
https://warnerchen.github.io/2025/05/15/通过-Target-Allocator-收集-Service-Pod-Monitor-Metrics/
install_url to use ShareThis. Please set it in _config.yml.