Prometheus Trouble Shooting
记录一些 Prometheus 使用问题排查方法。
Prometheus 磁盘使用率高
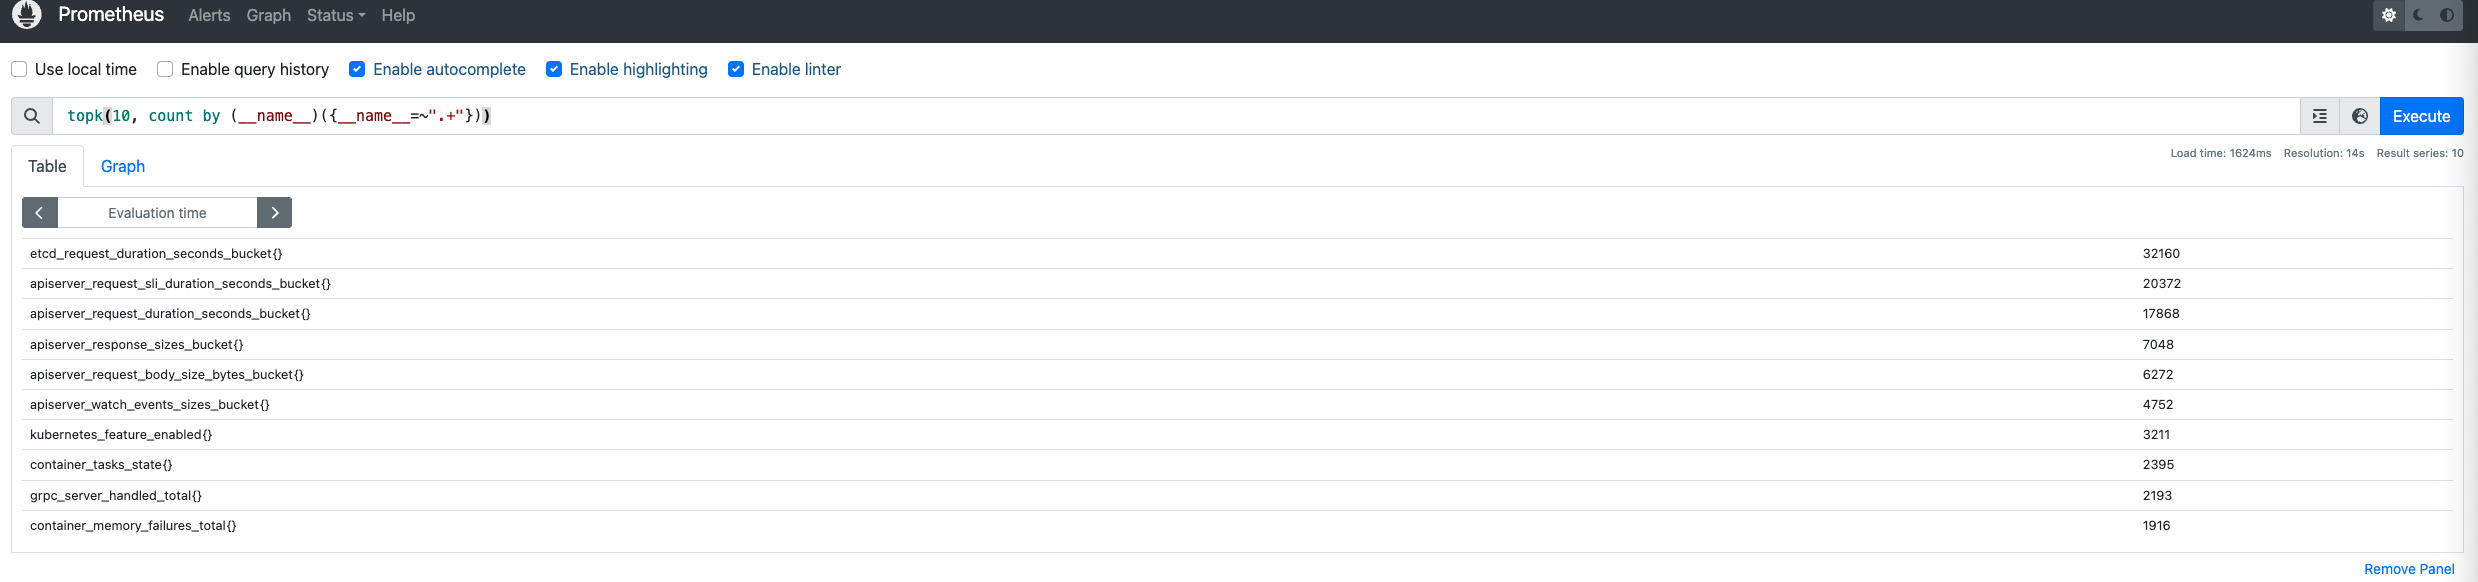
要想知道哪些指标占用了最多资源,最好是计算每个指标有多少时间序列,然后显示前 10 个指标:
1 | topk(10, count by (__name__)({__name__=~".+"})) |
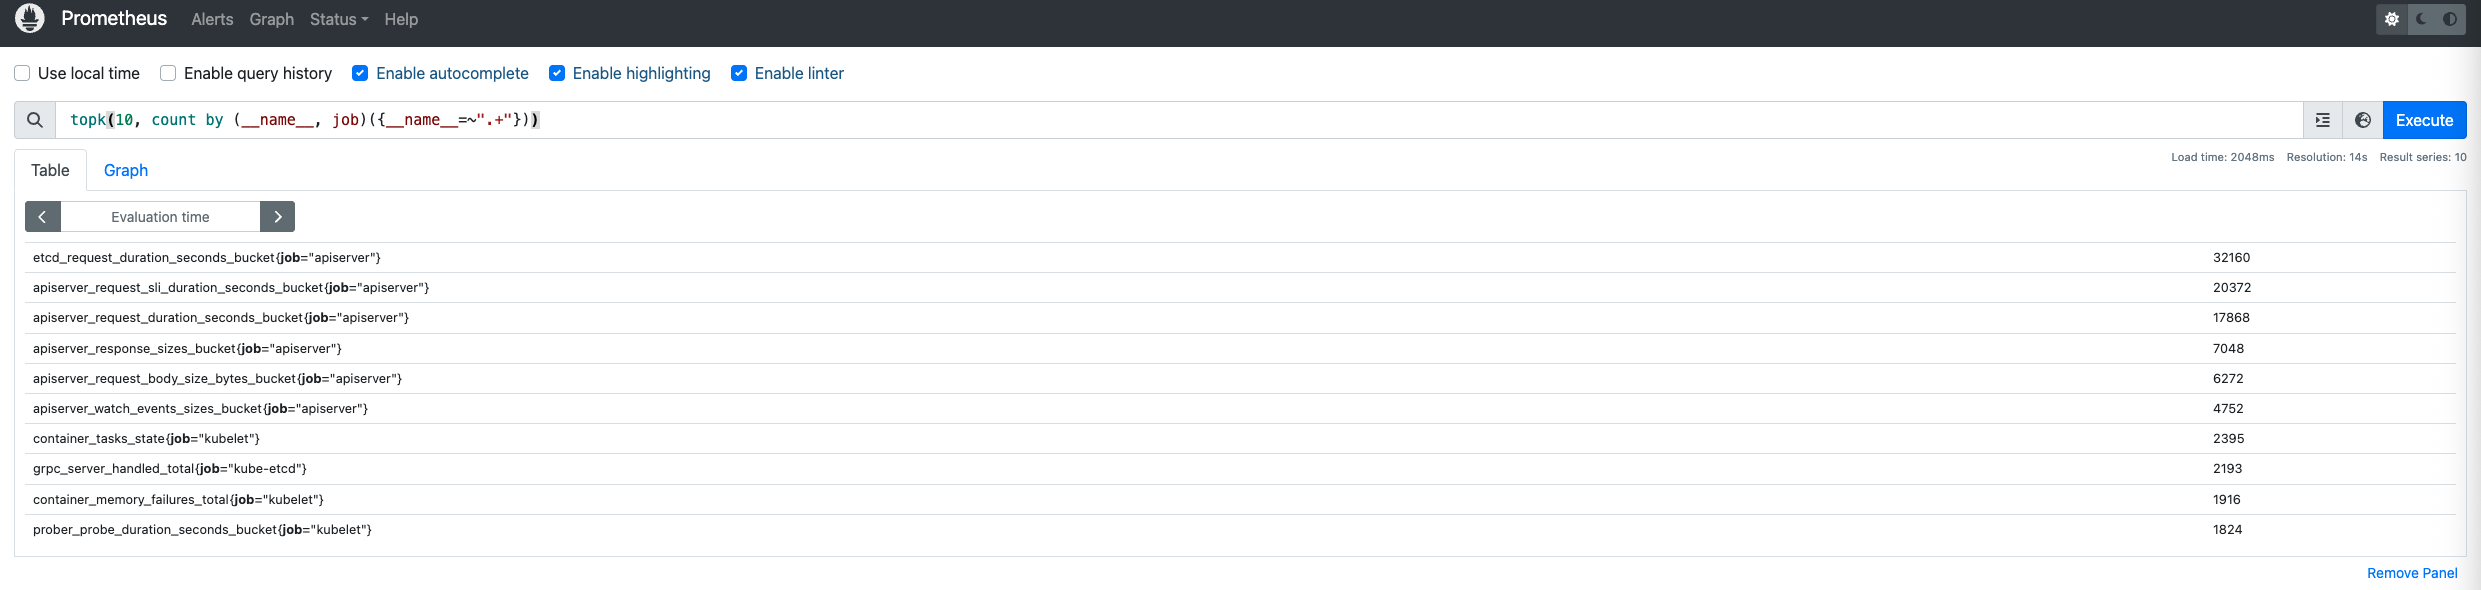
显示前 10 个指标属于哪个 Job:
1 | topk(10, count by (__name__, job)({__name__=~".+"})) |
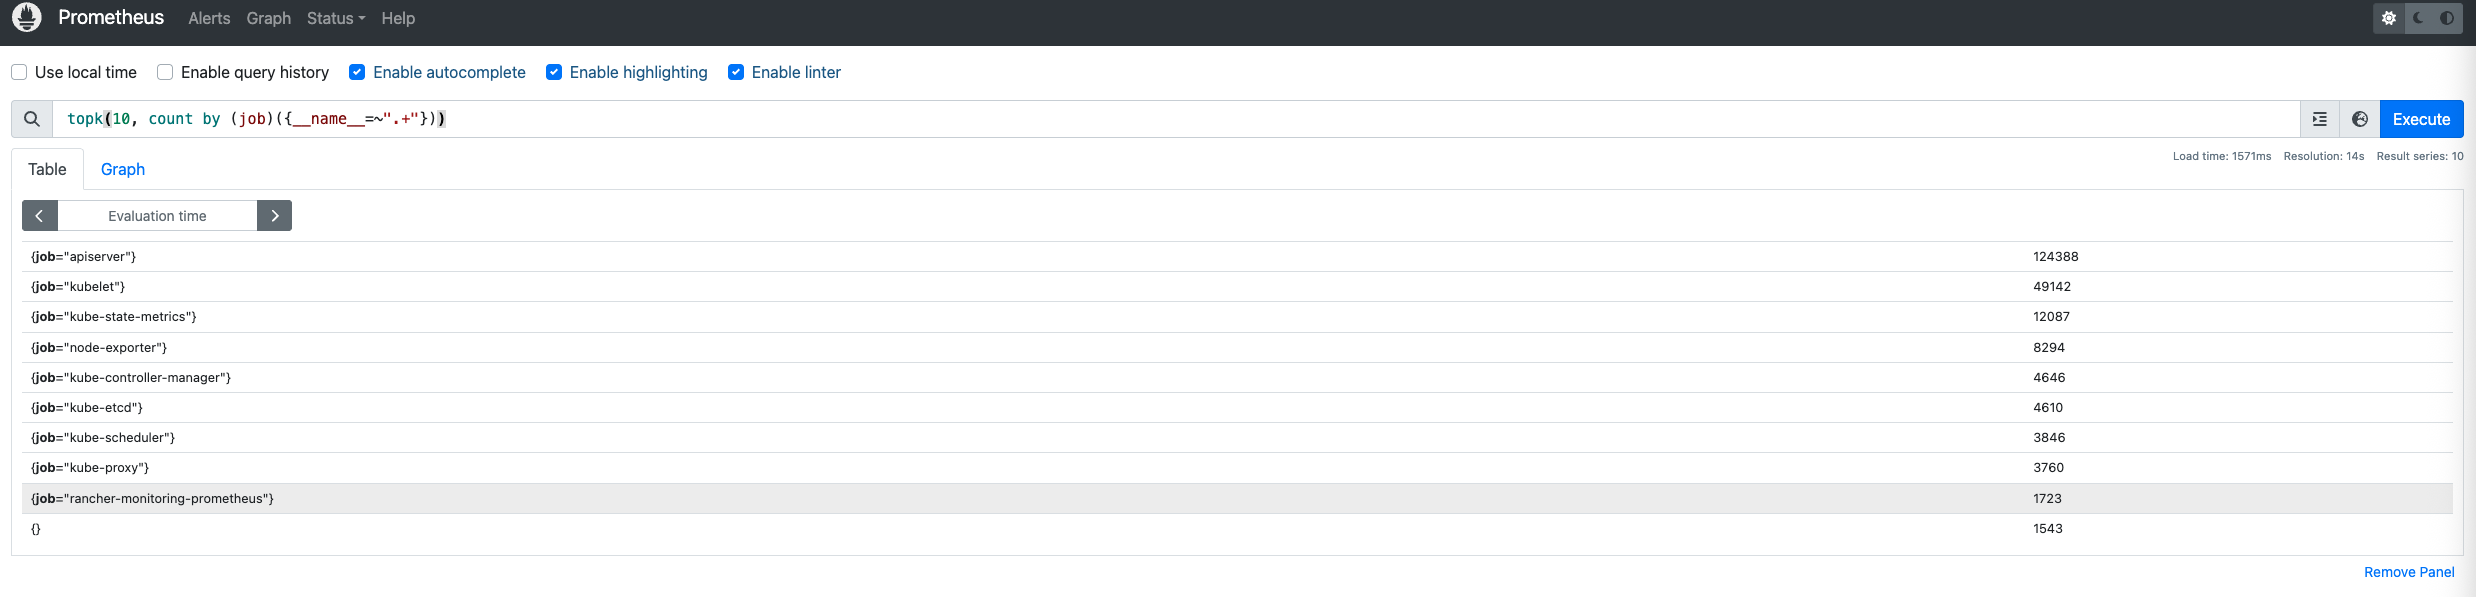
查看时间序列最多的前 10 个 Job:
1 | topk(10, count by (job)({__name__=~".+"})) |
需要注意的是,这类 PromQL 会查询 Prometheus 中所有的指标,如果数据量大的话,可能会造成 Prometheus 有较高的负载。
获取某个 Job 的所有指标
1 | curl -s --get --data-urlencode 'match[]={job="<job_name>"}' 'http://<prometheus_pod_ip>:9090/api/v1/label/__name__/values' | jq |
Prometheus Trouble Shooting
https://warnerchen.github.io/2025/05/29/Prometheus-Trouble-Shooting/
You need to set
install_url to use ShareThis. Please set it in _config.yml.