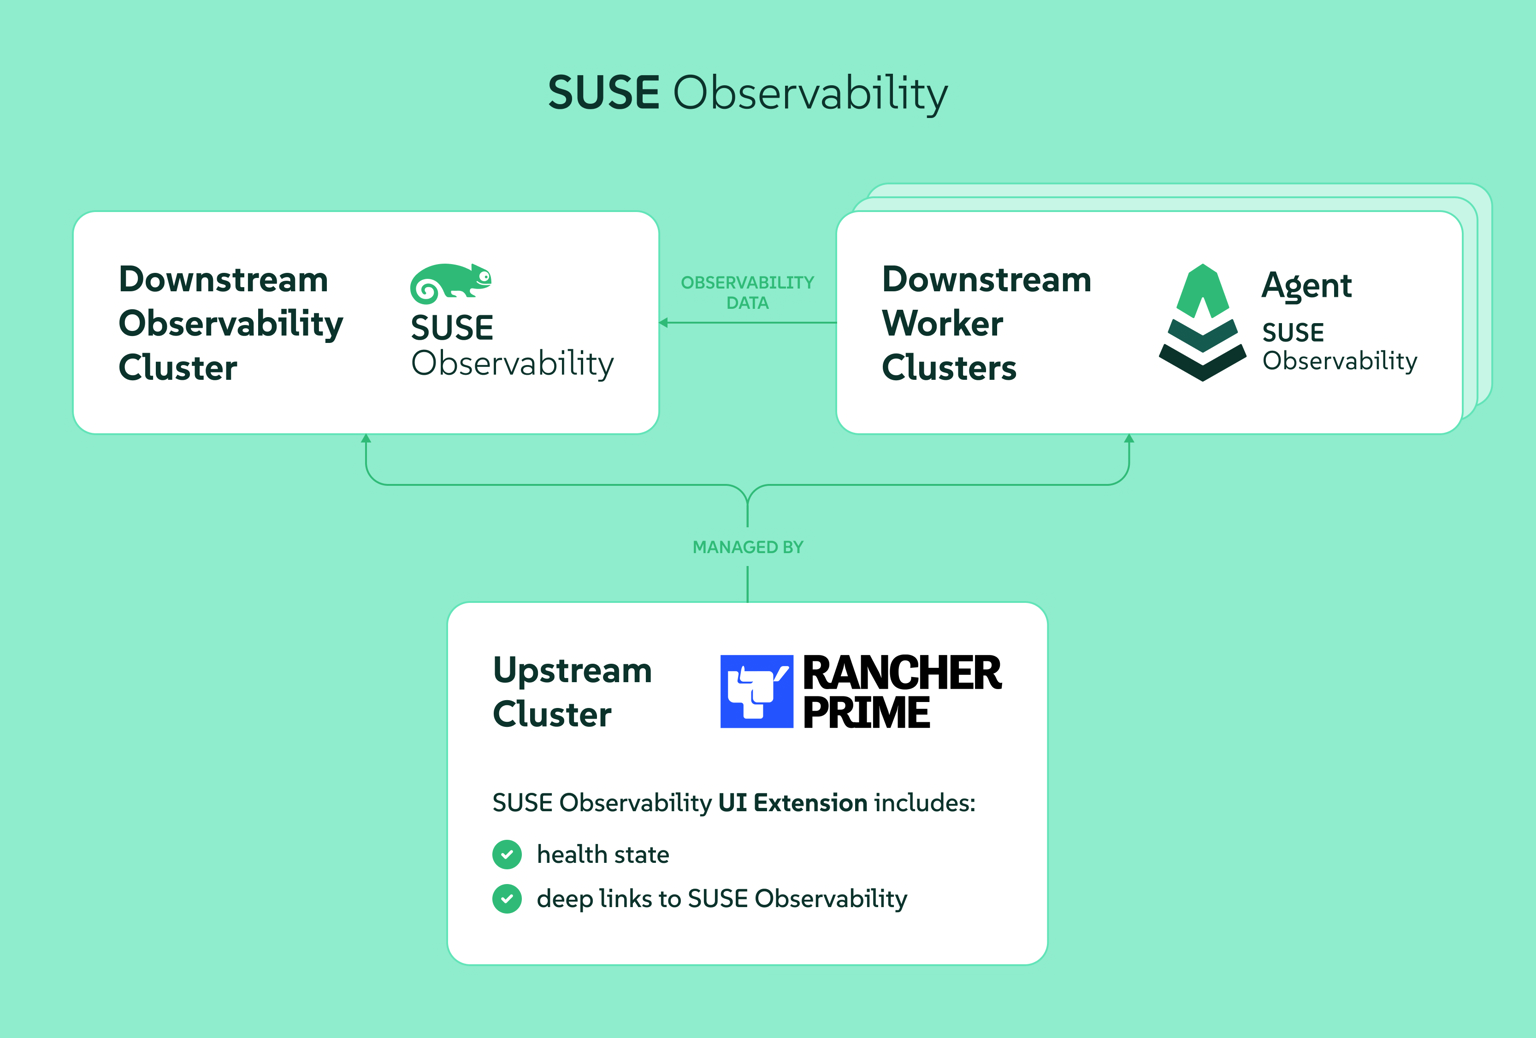
SUSE Observability(前身为 StackState)可用于观察 Kubernetes 集群及其工作负载。
SUSE Observability 主要分为 Server 和 Agent 两个部分,Server 负责存储和展示数据,Agent 负责采集数据并发送给 Server。
Server 的组件有:
- Topology (StackGraph)
- Metrics (VictoriaMetrics)
- Traces (ClickHouse)
- Logs (ElasticSearch)
部署 SUSE Observability
基于 Rancher Prime 的 SUSE Observability 部署文档
helm template 的命令会生成两个 values 文件,baseConfig_values.yaml 配置 license 等信息,sizing_values.yaml 配置集群规模等信息:
1
2
3
4
5
6
7
8
9
10
11
12
13
14
| helm repo add suse-observability https://charts.rancher.com/server-charts/prime/suse-observability
helm repo update
kubectl create namespace suse-observability
export VALUES_DIR=.
helm template \
--set license='xxx' \
--set baseUrl='http://suse-observability.warnerchen.com' \
--set sizing.profile='trial' \
--set adminPassword='xxx' \
--set imageRegistry='harbor.warnerchen.com' \
suse-observability-values \
suse-observability/suse-observability-values --output-dir $VALUES_DIR
|
安装前,创建 ingress_values.yaml、ingress_otel_values.yaml 中添加 Ingress 配置:
1
2
3
4
5
6
7
8
9
10
11
12
13
| cat <<EOF > $VALUES_DIR/suse-observability-values/templates/ingress_values.yaml
ingress:
enabled: true
annotations:
nginx.ingress.kubernetes.io/proxy-body-size: "50m"
hosts:
- host: suse-observability.warnerchen.com
# # 如果有权威证书/私有 CA 下发的证书,则使用 https
# tls:
# - secretName: suse-o11y-tls
# hosts:
# - suse-observability.warnerchen.com
EOF
|
1
2
3
4
5
6
7
8
9
10
11
12
13
14
15
16
17
18
19
20
21
22
23
24
25
26
27
28
29
30
31
32
| cat <<EOF > $VALUES_DIR/suse-observability-values/templates/ingress_otel_values.yaml
opentelemetry-collector:
ingress:
enabled: true
annotations:
nginx.ingress.kubernetes.io/proxy-body-size: "50m"
nginx.ingress.kubernetes.io/backend-protocol: GRPC
hosts:
- host: suse-observability-otlp.warnerchen.com
paths:
- path: /
pathType: Prefix
port: 4317
tls:
- hosts:
- suse-observability-otlp.warnerchen.com
secretName: suse-o11y-tls
additionalIngresses:
- name: otlp-http
annotations:
nginx.ingress.kubernetes.io/proxy-body-size: "50m"
hosts:
- host: suse-observability-otlp-http.warnerchen.com
paths:
- path: /
pathType: Prefix
port: 4318
tls:
- hosts:
- suse-observability-otlp-http.warnerchen.com
secretName: suse-o11y-tls
EOF
|
创建自签名证书给 SUSE O11y/Otlp Ingress 使用:
参考文档创建:https://docs.rancher.cn/docs/rancher2.5/installation/resources/advanced/self-signed-ssl/
1
2
3
| ./create_self-signed-cert.sh --ssl-domain=suse-observability.warnerchen.com --ssl-trusted-domain=suse-observability-otlp.warnerchen.com,suse-observability-otlp-http.warnerchen.com --ssl-trusted-ip=172.16.16.110,172.16.16.111,172.16.16.112 --ssl-size=2048 --ssl-date=3650
kubectl -n suse-observability create secret tls suse-o11y-tls --cert=tls.crt --key=tls.key
|
执行安装:
1
2
3
4
5
6
7
8
| helm upgrade \
--install \
--namespace suse-observability \
--values $VALUES_DIR/suse-observability-values/templates/baseConfig_values.yaml \
--values $VALUES_DIR/suse-observability-values/templates/sizing_values.yaml \
--values $VALUES_DIR/suse-observability-values/templates/ingress_values.yaml \
--values $VALUES_DIR/suse-observability-values/templates/ingress_otel_values.yaml \
suse-observability suse-observability/suse-observability
|
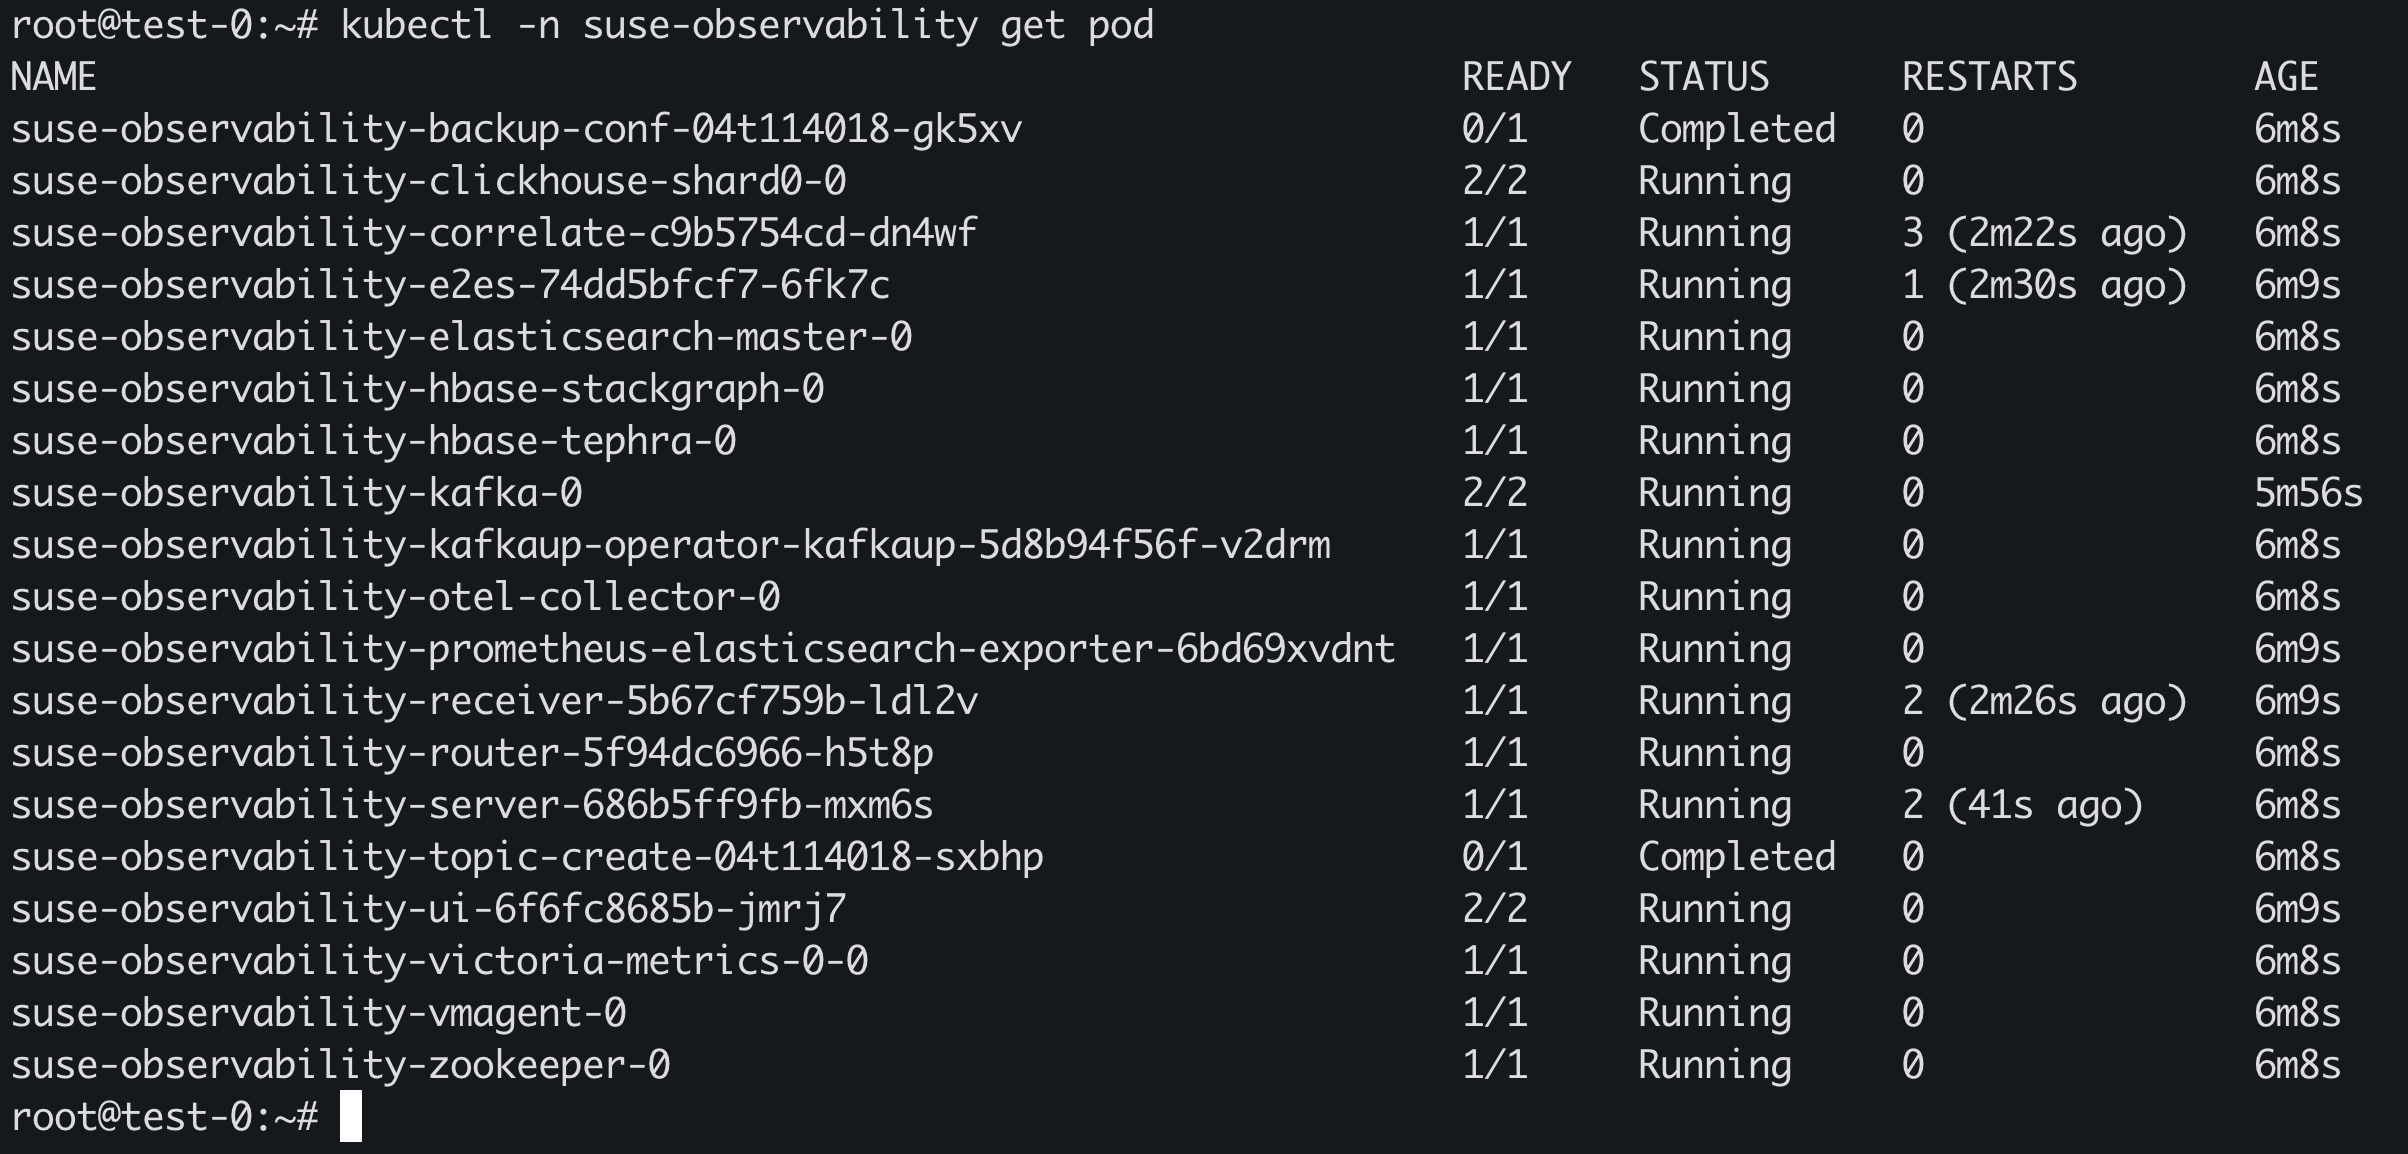
等待所有 Pod 运行完毕:
通过 Service suse-observability-router / Ingress 访问 SUSE Observability UI:
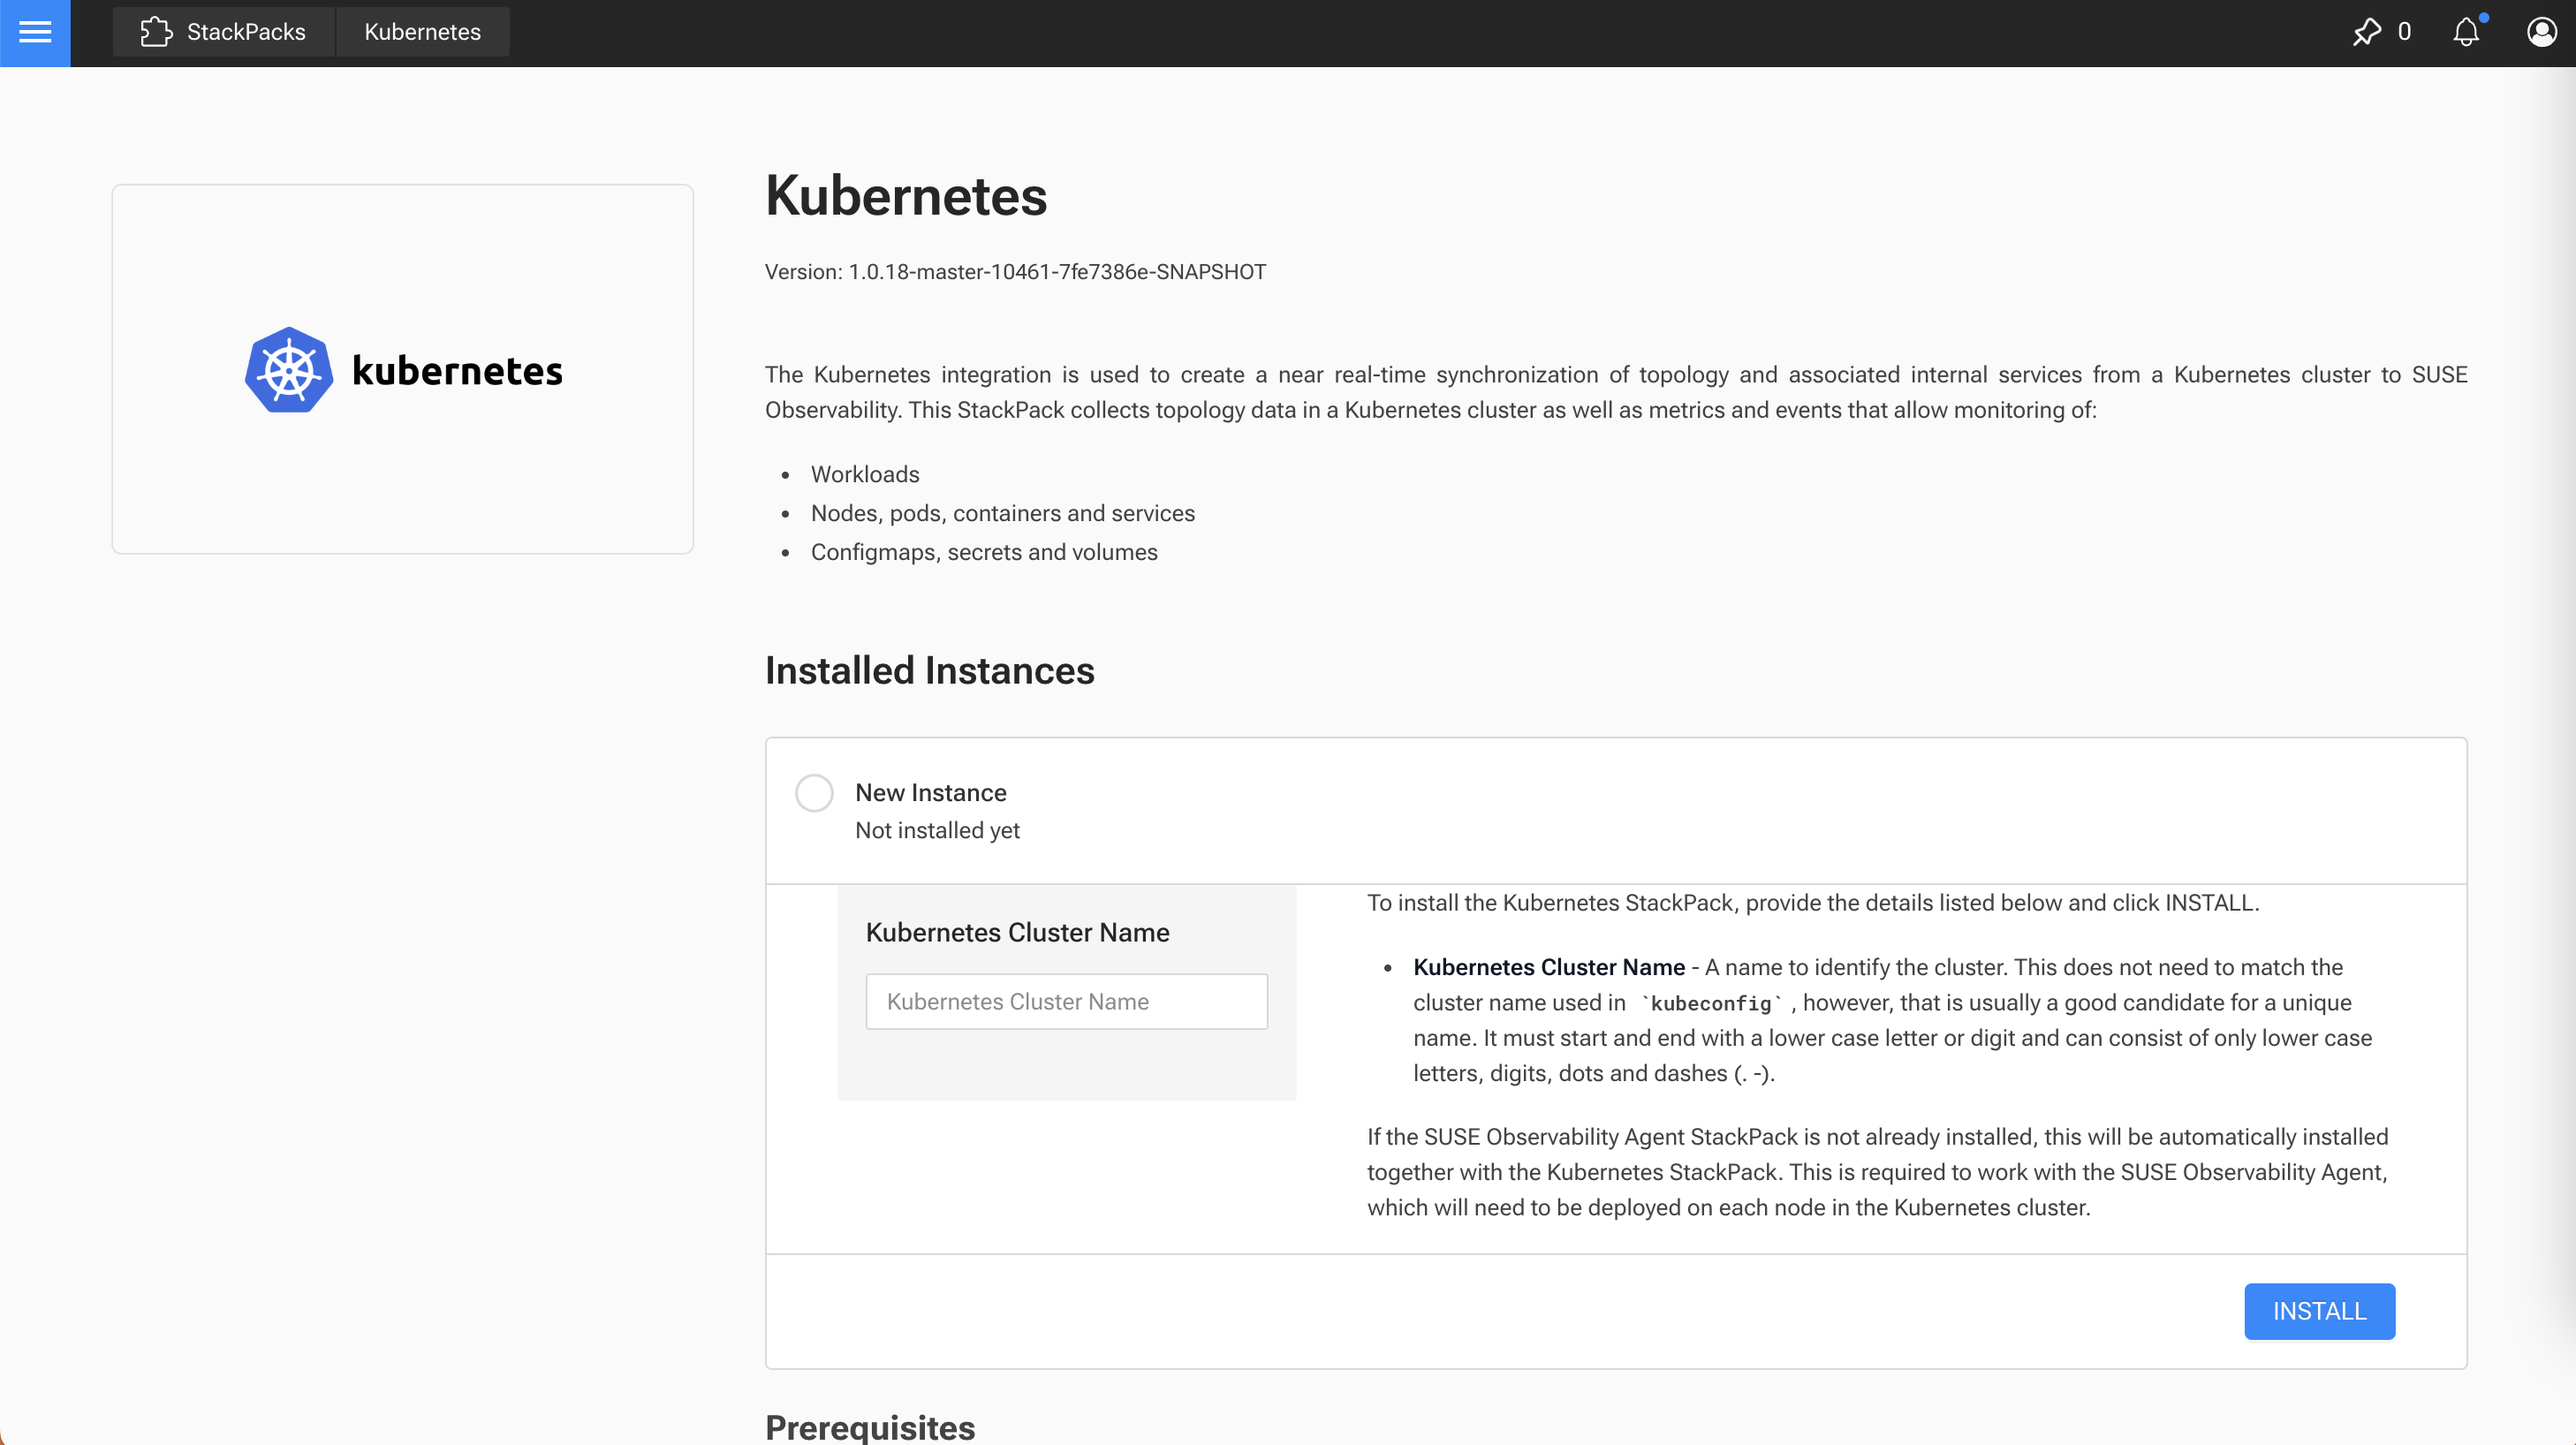
部署 SUSE Observability Agent
被监控集群需要部署 Agent 才能够进行监控。
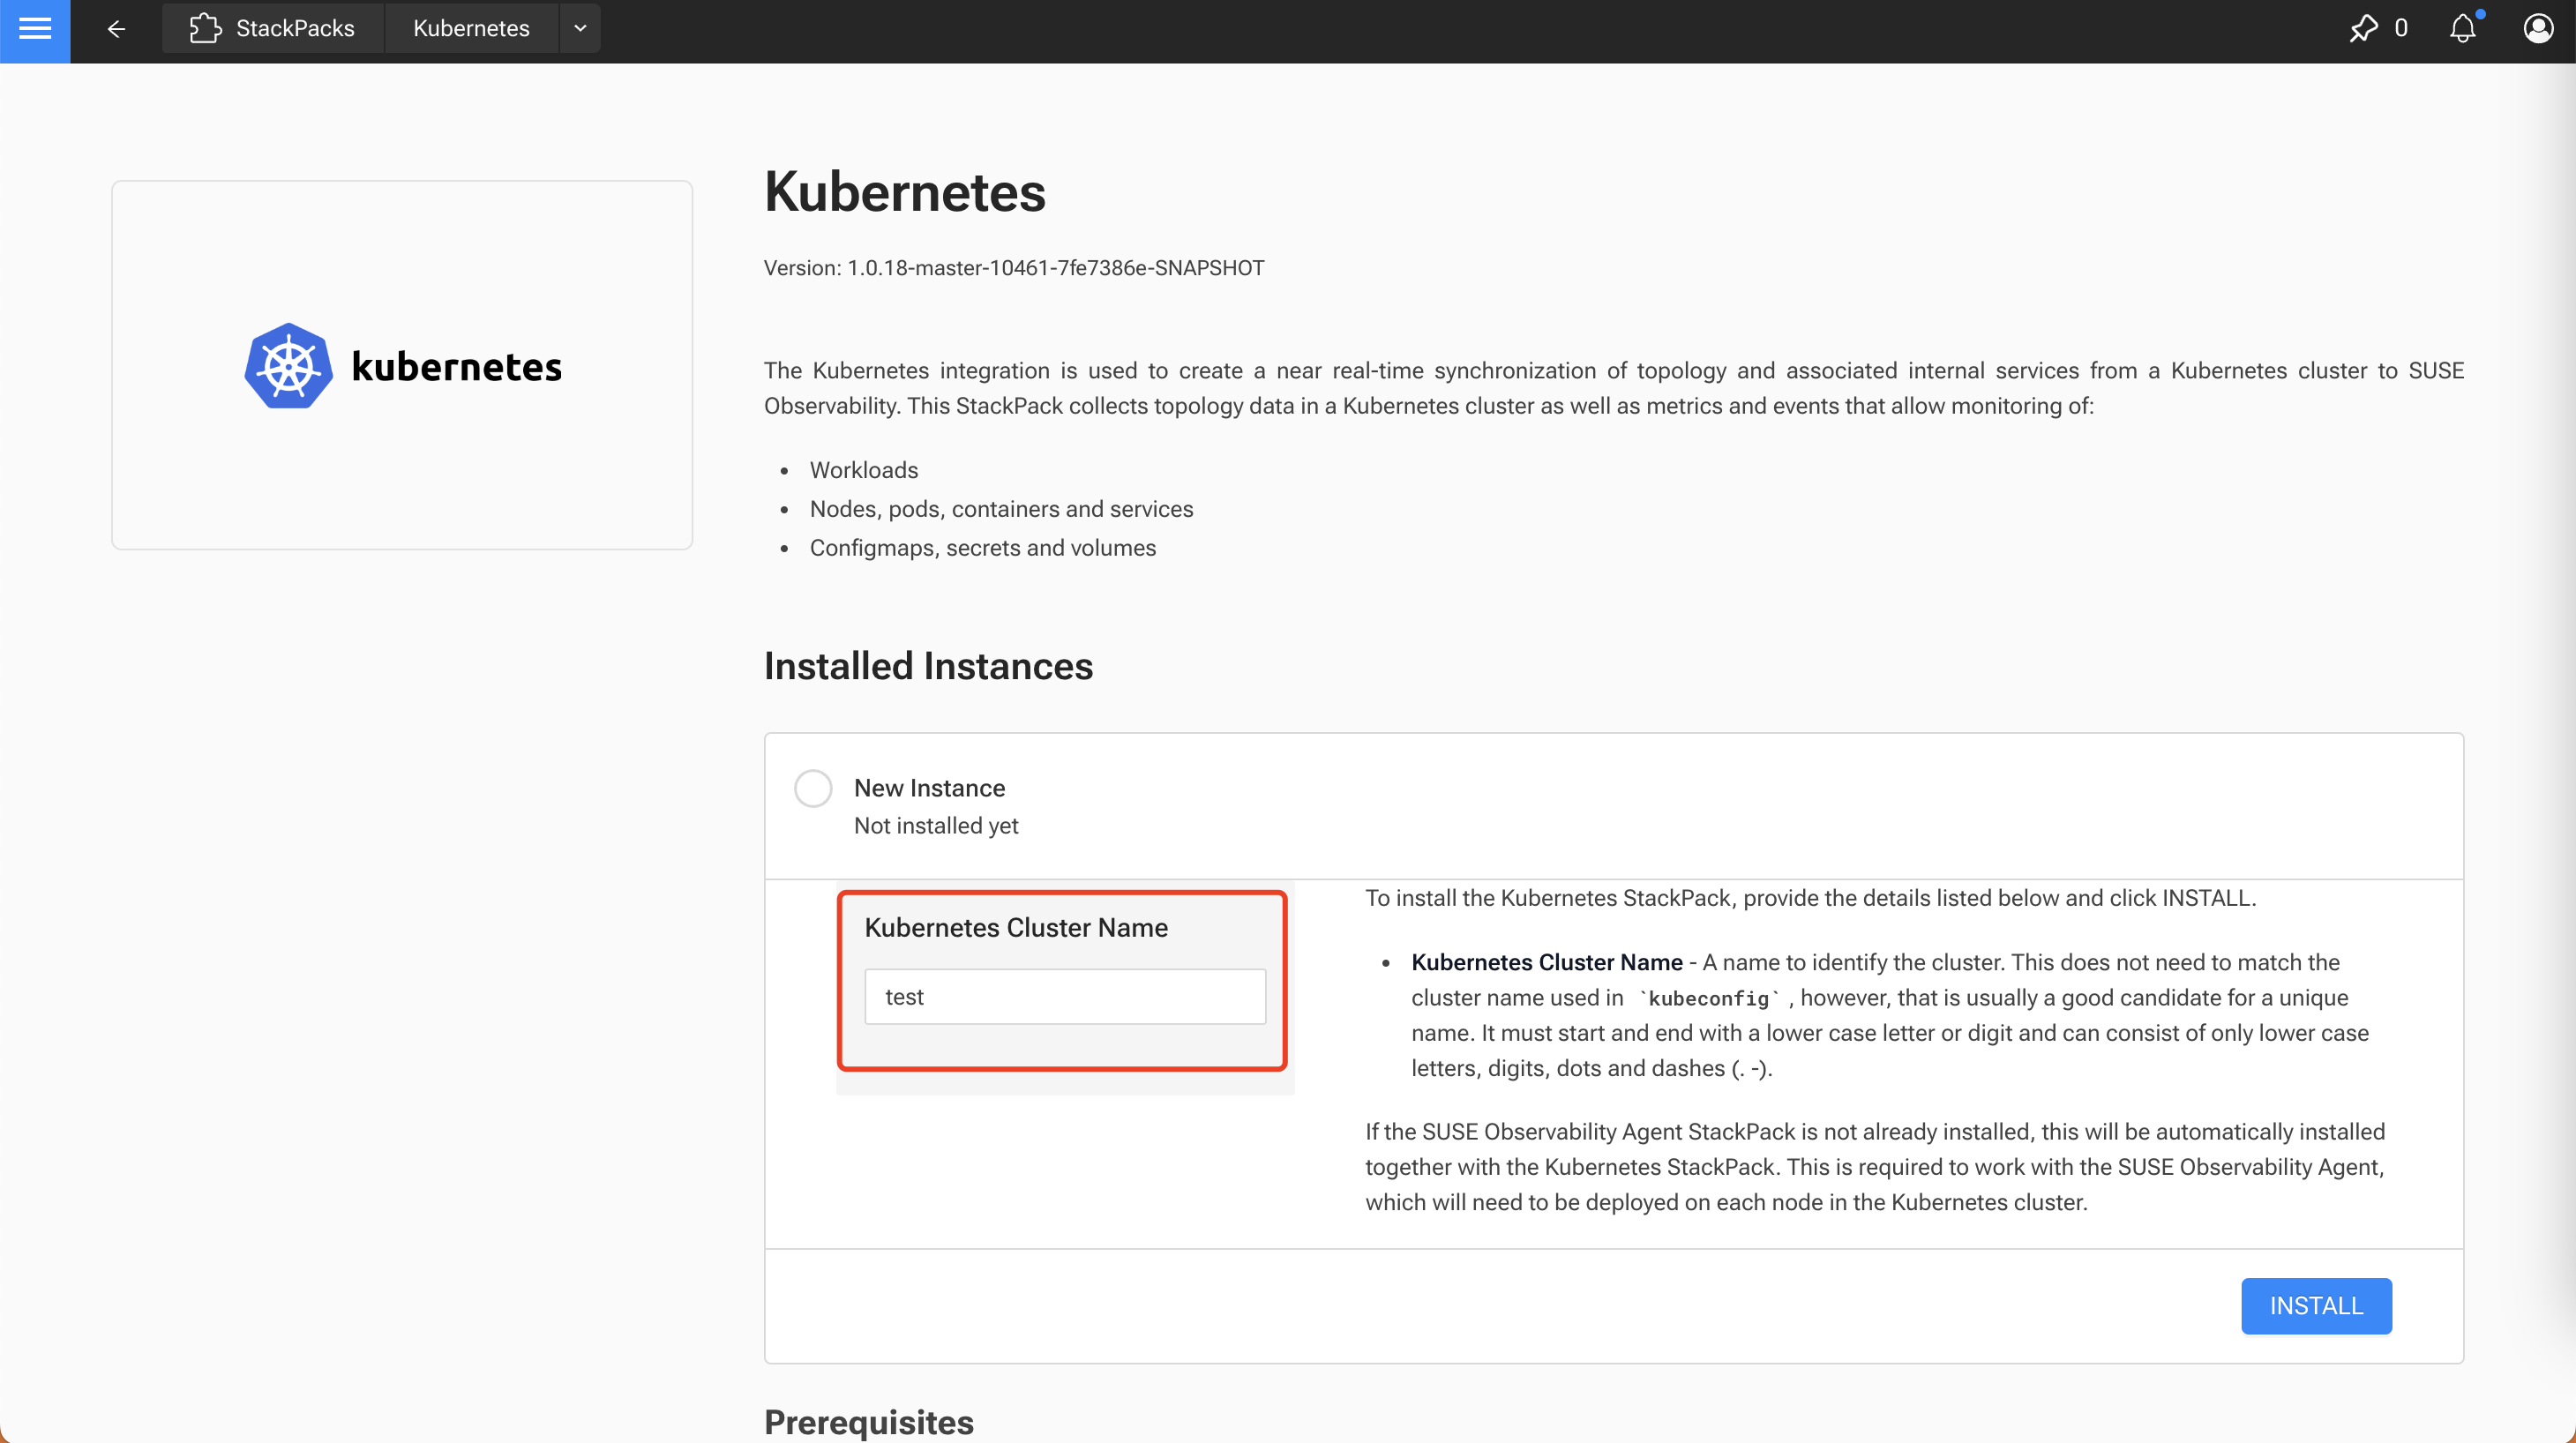
在 StackPacks 选择 Kubernetes,然后填入集群名称:
点击 Install 后,会提供安装命令:
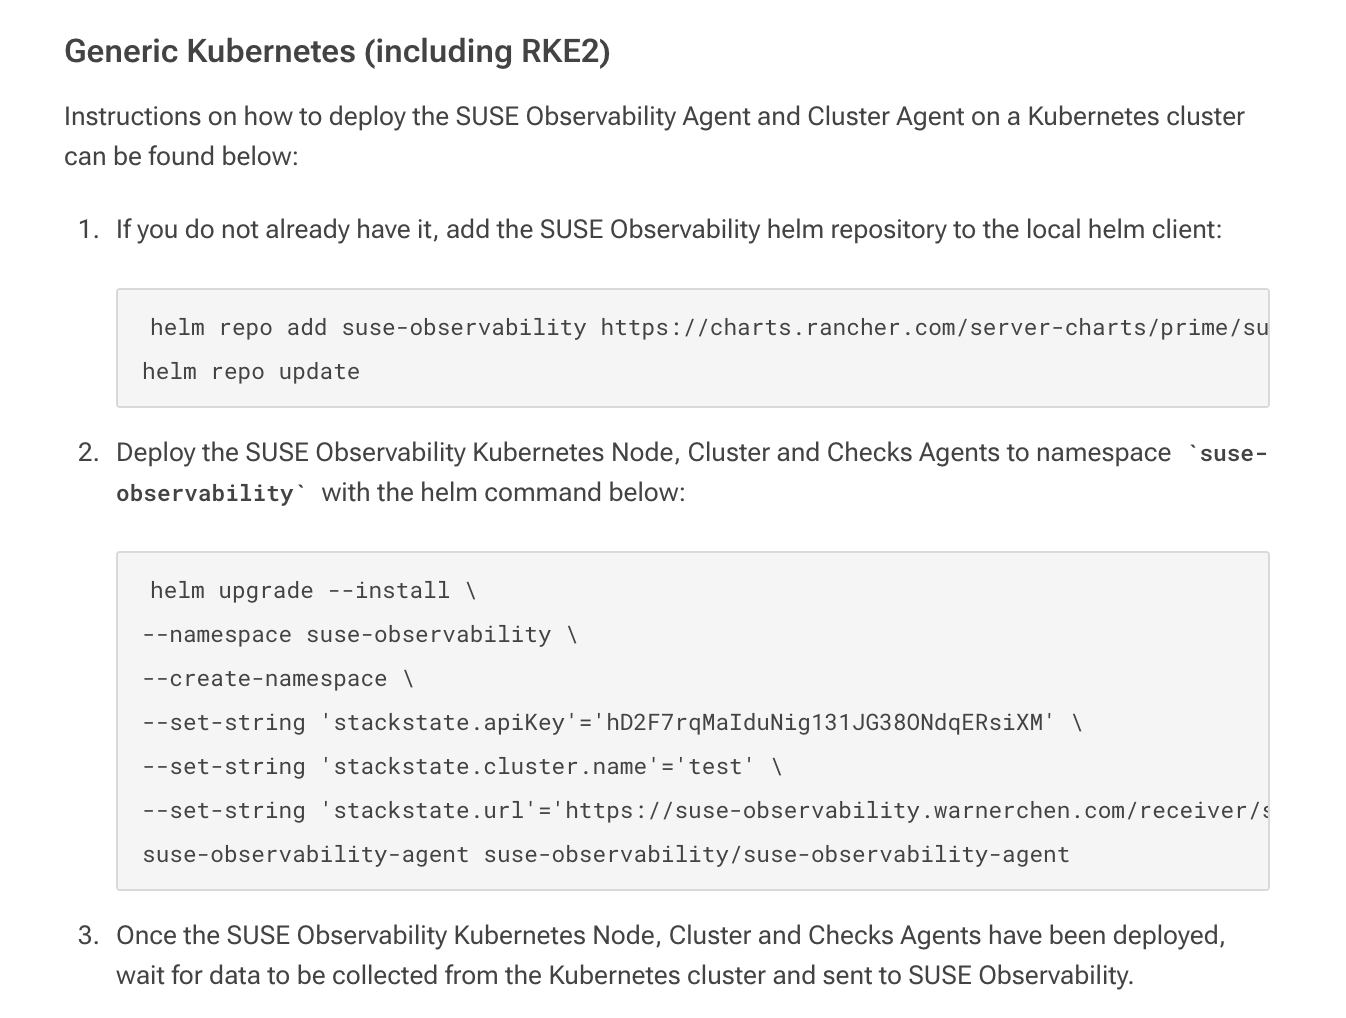
在被监控集群执行安装:
1
2
3
4
5
6
7
8
9
| helm upgrade --install \
--namespace suse-observability \
--create-namespace \
--set-string 'stackstate.apiKey'='xxx' \
--set-string 'stackstate.cluster.name'='test' \
--set-string 'stackstate.url'='https://suse-observability.warnerchen.com/receiver/stsAgent' \
--set-string 'global.skipSslValidation'='true' \
--set-string 'global.imageRegistry'='harbor.warnerchen.com' \
suse-observability-agent suse-observability/suse-observability-agent
|
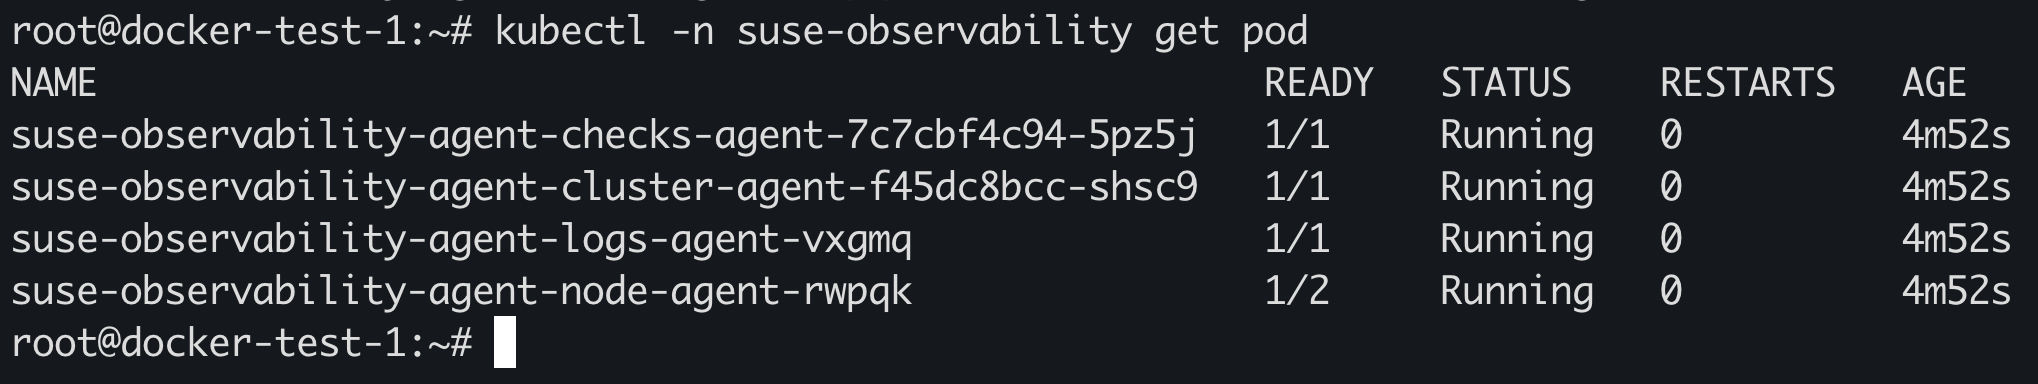
等待所有 Pod 正常运行:
收集 Traces 数据
通过 Helm Chart 部署 Open Telemetry Collector
收集被监控集群的 Traces 数据,还需要部署 Open Telemetry Collector。
参考文档:https://documentation.suse.com/cloudnative/suse-observability/latest/en/setup/otel/getting-started/getting-started-k8s.html
准备 values.yaml:
1
2
3
4
5
6
7
8
9
10
11
12
13
14
15
16
17
18
19
20
21
22
23
24
25
26
27
28
29
30
31
32
33
34
35
36
37
38
39
40
41
42
43
44
45
46
47
48
49
50
51
52
53
54
55
56
57
58
59
60
61
62
63
64
65
66
67
68
69
70
71
72
73
74
75
76
77
78
79
80
81
82
| cat <<EOF > otel-collector.yaml
extraEnvsFrom:
- secretRef:
name: open-telemetry-collector
mode: deployment
image:
repository: "ghcr.io/open-telemetry/opentelemetry-collector-releases/opentelemetry-collector-k8s"
ports:
metrics:
enabled: true
presets:
kubernetesAttributes:
enabled: true
extractAllPodLabels: true
config:
receivers:
otlp:
protocols:
grpc:
endpoint: 0.0.0.0:4317
http:
endpoint: 0.0.0.0:4318
extensions:
bearertokenauth:
scheme: SUSEObservability
token: "${env:API_KEY}"
exporters:
nop: {}
otlp/suse-observability:
auth:
authenticator: bearertokenauth
# 修改为实际的 SUSE O11y Server 集群的 otlp ingress host
endpoint: suse-observability-otlp.warnerchen.com:443
tls:
insecure_skip_verify: true
compression: snappy
otlphttp/suse-observability:
auth:
authenticator: bearertokenauth
# 修改为实际的 SUSE O11y Server 集群的 otlp http ingress host
endpoint: https://suse-observability-otlp-http.warnerchen.com
tls:
insecure_skip_verify: true
compression: snappy
processors:
memory_limiter:
check_interval: 5s
limit_percentage: 80
spike_limit_percentage: 25
batch: {}
resource:
attributes:
- key: k8s.cluster.name
action: upsert
# 修改为实际的集群名称
value: <your-cluster-name>
- key: service.instance.id
from_attribute: k8s.pod.uid
action: insert
- key: service.namespace
from_attribute: k8s.namespace.name
action: insert
connectors:
spanmetrics:
metrics_expiration: 5m
namespace: otel_span
service:
extensions: [ health_check, bearertokenauth ]
pipelines:
traces:
receivers: [otlp]
processors: [memory_limiter, resource, batch]
exporters: [debug, spanmetrics, otlp/suse-observability]
metrics:
receivers: [otlp, spanmetrics, prometheus]
processors: [memory_limiter, resource, batch]
exporters: [debug, otlp/suse-observability]
logs:
receivers: [otlp]
processors: []
exporters: [nop]
EOF
|
部署 Open Telemetry Collector:
1
2
3
4
5
6
7
8
9
10
11
12
13
| kubectl create ns open-telemetry
kubectl create secret generic open-telemetry-collector \
--namespace open-telemetry \
--from-literal=API_KEY='<suse-observability-api-key>'
helm repo add open-telemetry https://open-telemetry.github.io/opentelemetry-helm-charts
helm repo update
helm upgrade --install opentelemetry-collector open-telemetry/opentelemetry-collector \
--values otel-collector.yaml \
--namespace open-telemetry
|
通过 Operator 部署 Open Telemetry Collector
也可以通过 Operator 部署,参考文档:https://documentation.suse.com/cloudnative/suse-observability/latest/en/setup/otel/getting-started/getting-started-k8s-operator.html
准备 Namespace 和 Secret:
1
2
3
4
5
| kubectl create namespace open-telemetry
kubectl create secret generic open-telemetry-collector \
--namespace open-telemetry \
--from-literal=API_KEY='<suse-observability-api-key>'
|
部署 Operator:
1
2
3
4
5
6
7
8
9
10
11
12
13
14
15
16
17
18
19
20
21
22
23
24
25
26
27
28
29
30
31
32
33
34
35
36
37
38
39
40
41
| helm repo add open-telemetry https://open-telemetry.github.io/opentelemetry-helm-charts
cat <<EOF > otel-operator.yaml
imagePullSecrets: []
manager:
image:
repository: ghcr.io/open-telemetry/opentelemetry-operator/opentelemetry-operator
collectorImage:
repository: otel/opentelemetry-collector-k8s
tag: 0.123.0
targetAllocatorImage:
repository: ""
tag: ""
autoInstrumentationImage:
java:
repository: ""
tag: ""
nodejs:
repository: ""
tag: ""
python:
repository: ""
tag: ""
dotnet:
repository: ""
tag: ""
go:
repository: ""
tag: ""
admissionWebhooks:
certManager:
enabled: false
autoGenerateCert:
enabled: true
EOF
helm upgrade --install opentelemetry-operator open-telemetry/opentelemetry-operator \
--namespace open-telemetry \
--version 0.87.0 \
--values otel-operator.yaml
|
创建 Open Telemetry Collector
1
2
3
4
5
6
7
8
9
10
11
12
13
14
15
16
17
18
19
20
21
22
23
24
25
26
27
28
29
30
31
32
33
34
35
36
37
38
39
40
41
42
43
44
45
46
47
48
49
50
51
52
53
54
55
56
57
58
59
60
61
62
63
64
65
66
67
68
69
70
71
72
73
74
75
76
77
78
79
80
81
82
83
84
85
86
87
88
89
90
91
92
93
94
| cat <<EOF | kubectl apply -f -
apiVersion: opentelemetry.io/v1beta1
kind: OpenTelemetryCollector
metadata:
name: otel-collector
namespace: open-telemetry
spec:
mode: deployment
image: otel/opentelemetry-collector-k8s:0.123.0
envFrom:
- secretRef:
name: open-telemetry-collector
config:
receivers:
otlp:
protocols:
grpc:
endpoint: 0.0.0.0:4317
http:
endpoint: 0.0.0.0:4318
prometheus:
config:
scrape_configs:
- job_name: opentelemetry-collector
scrape_interval: 10s
static_configs:
- targets:
- 0.0.0.0:8888
extensions:
health_check:
endpoint: 0.0.0.0:13133
bearertokenauth:
scheme: SUSEObservability
token: "${env:API_KEY}"
exporters:
debug: {}
nop: {}
otlp/suse-observability:
auth:
authenticator: bearertokenauth
# 修改为实际的 SUSE O11y Server 集群的 otlp ingress host
endpoint: suse-observability-otlp.warnerchen.com:443
tls:
insecure_skip_verify: true
compression: snappy
otlphttp/suse-observability:
auth:
authenticator: bearertokenauth
# 修改为实际的 SUSE O11y Server 集群的 otlp http ingress host
endpoint: https://suse-observability-otlp-http.warnerchen.com
tls:
insecure_skip_verify: true
compression: snappy
processors:
memory_limiter:
check_interval: 5s
limit_percentage: 80
spike_limit_percentage: 25
batch: {}
resource:
attributes:
- key: k8s.cluster.name
action: upsert
# 修改为实际的集群名称
value: <your-cluster-name>
- key: service.instance.id
from_attribute: k8s.pod.uid
action: insert
- key: service.namespace
from_attribute: k8s.namespace.name
action: insert
connectors:
spanmetrics:
metrics_expiration: 5m
namespace: otel_span
service:
extensions: [ health_check, bearertokenauth ]
pipelines:
traces:
receivers: [otlp]
processors: [memory_limiter, resource, batch]
exporters: [debug, spanmetrics, otlp/suse-observability]
metrics:
receivers: [otlp, spanmetrics, prometheus]
processors: [memory_limiter, resource, batch]
exporters: [debug, otlp/suse-observability]
logs:
receivers: [otlp]
processors: []
exporters: [nop]
telemetry:
metrics:
address: 0.0.0.0:8888
EOF
|
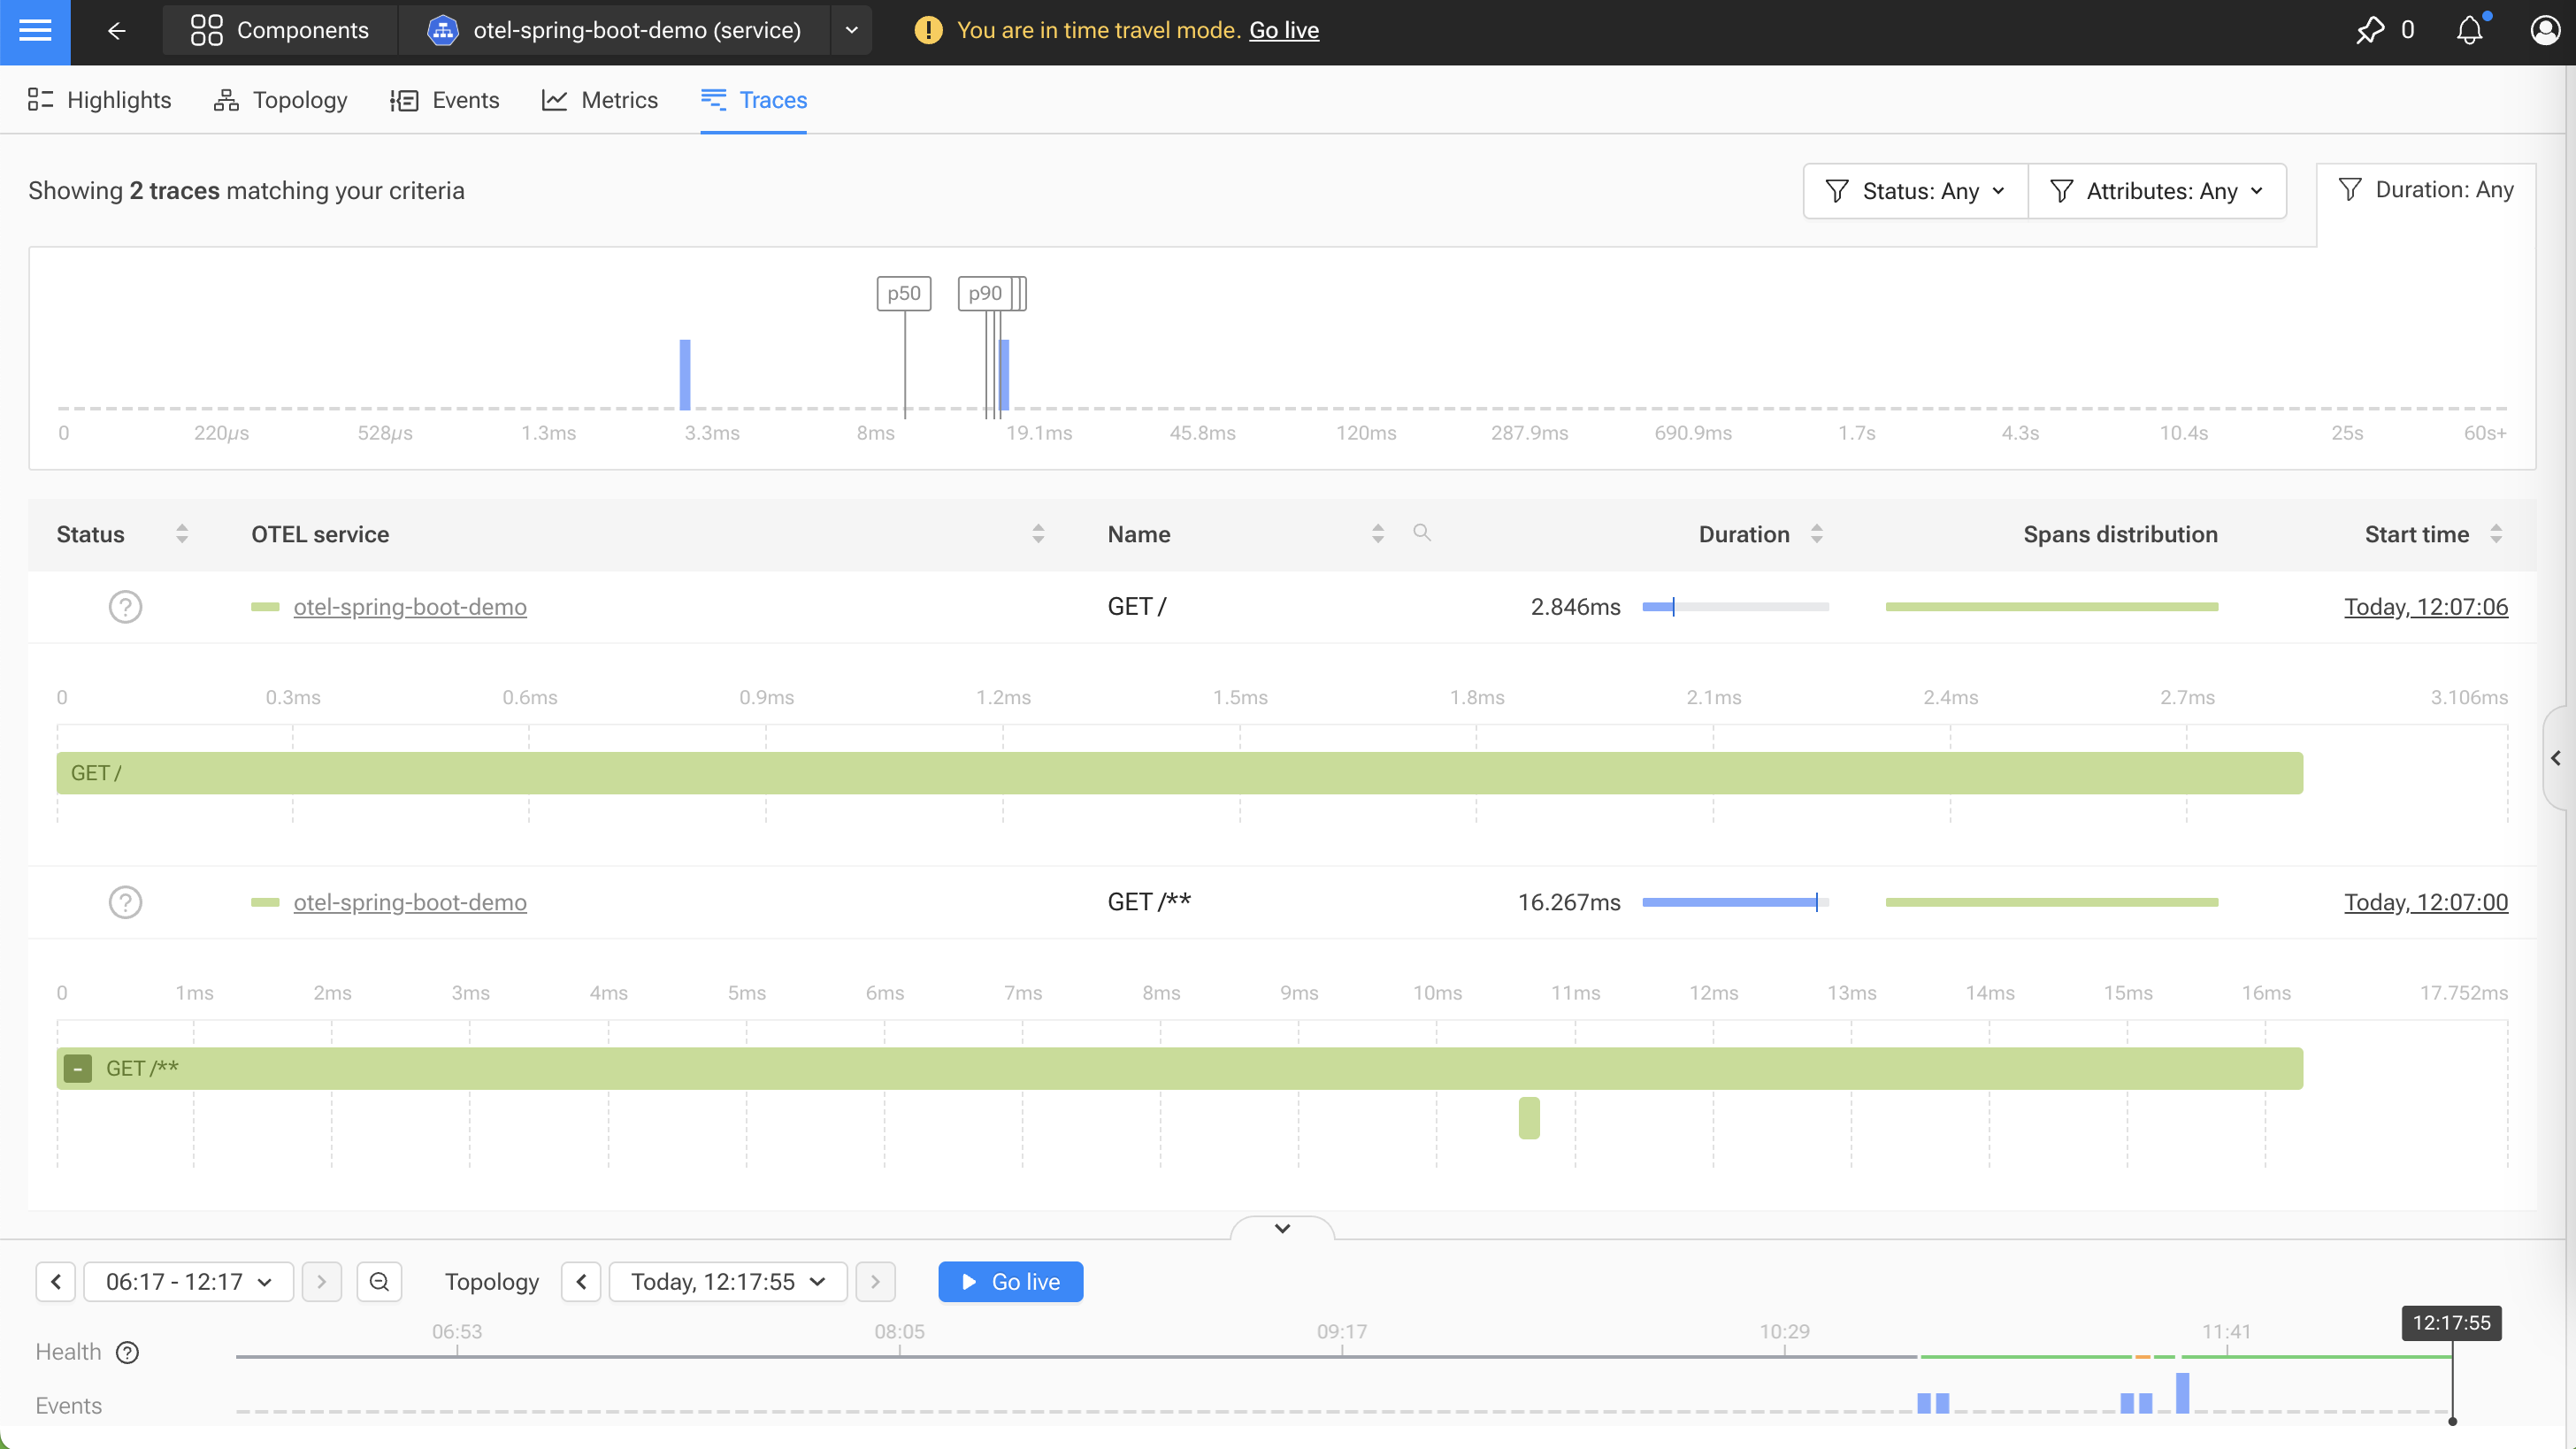
收集 Java 应用 Traces 数据
Instrumentation
此处为 Spring Boot 注入 OpenTelemetry Java Agent,其原理就是在 Java 启动命令中调用 OpenTelemetry 的 Java Agent,然后通过 Open Telemetry Collector 发送数据到 SUSE Observability。
DEMO 仓库地址:https://github.com/warnerchen/otel-spring-boot-demo.git
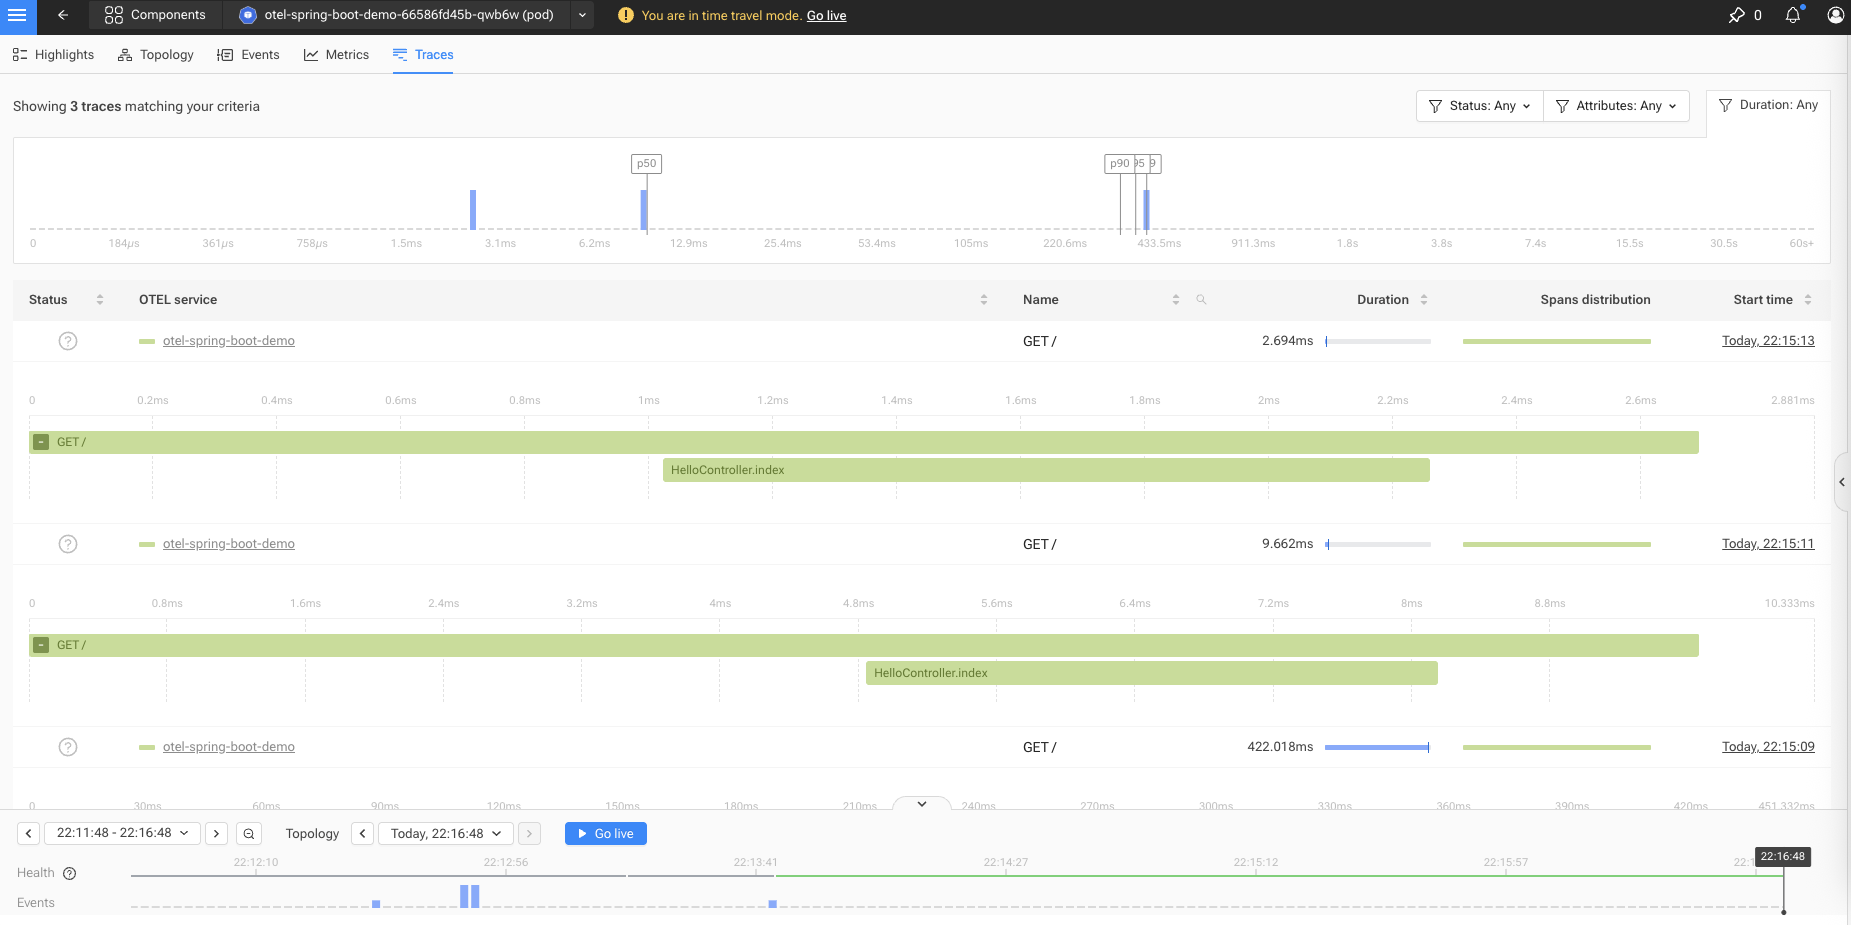
使用 deploy/deployment-instrumentation.yaml、deploy/service.yaml 部署后效果如下:
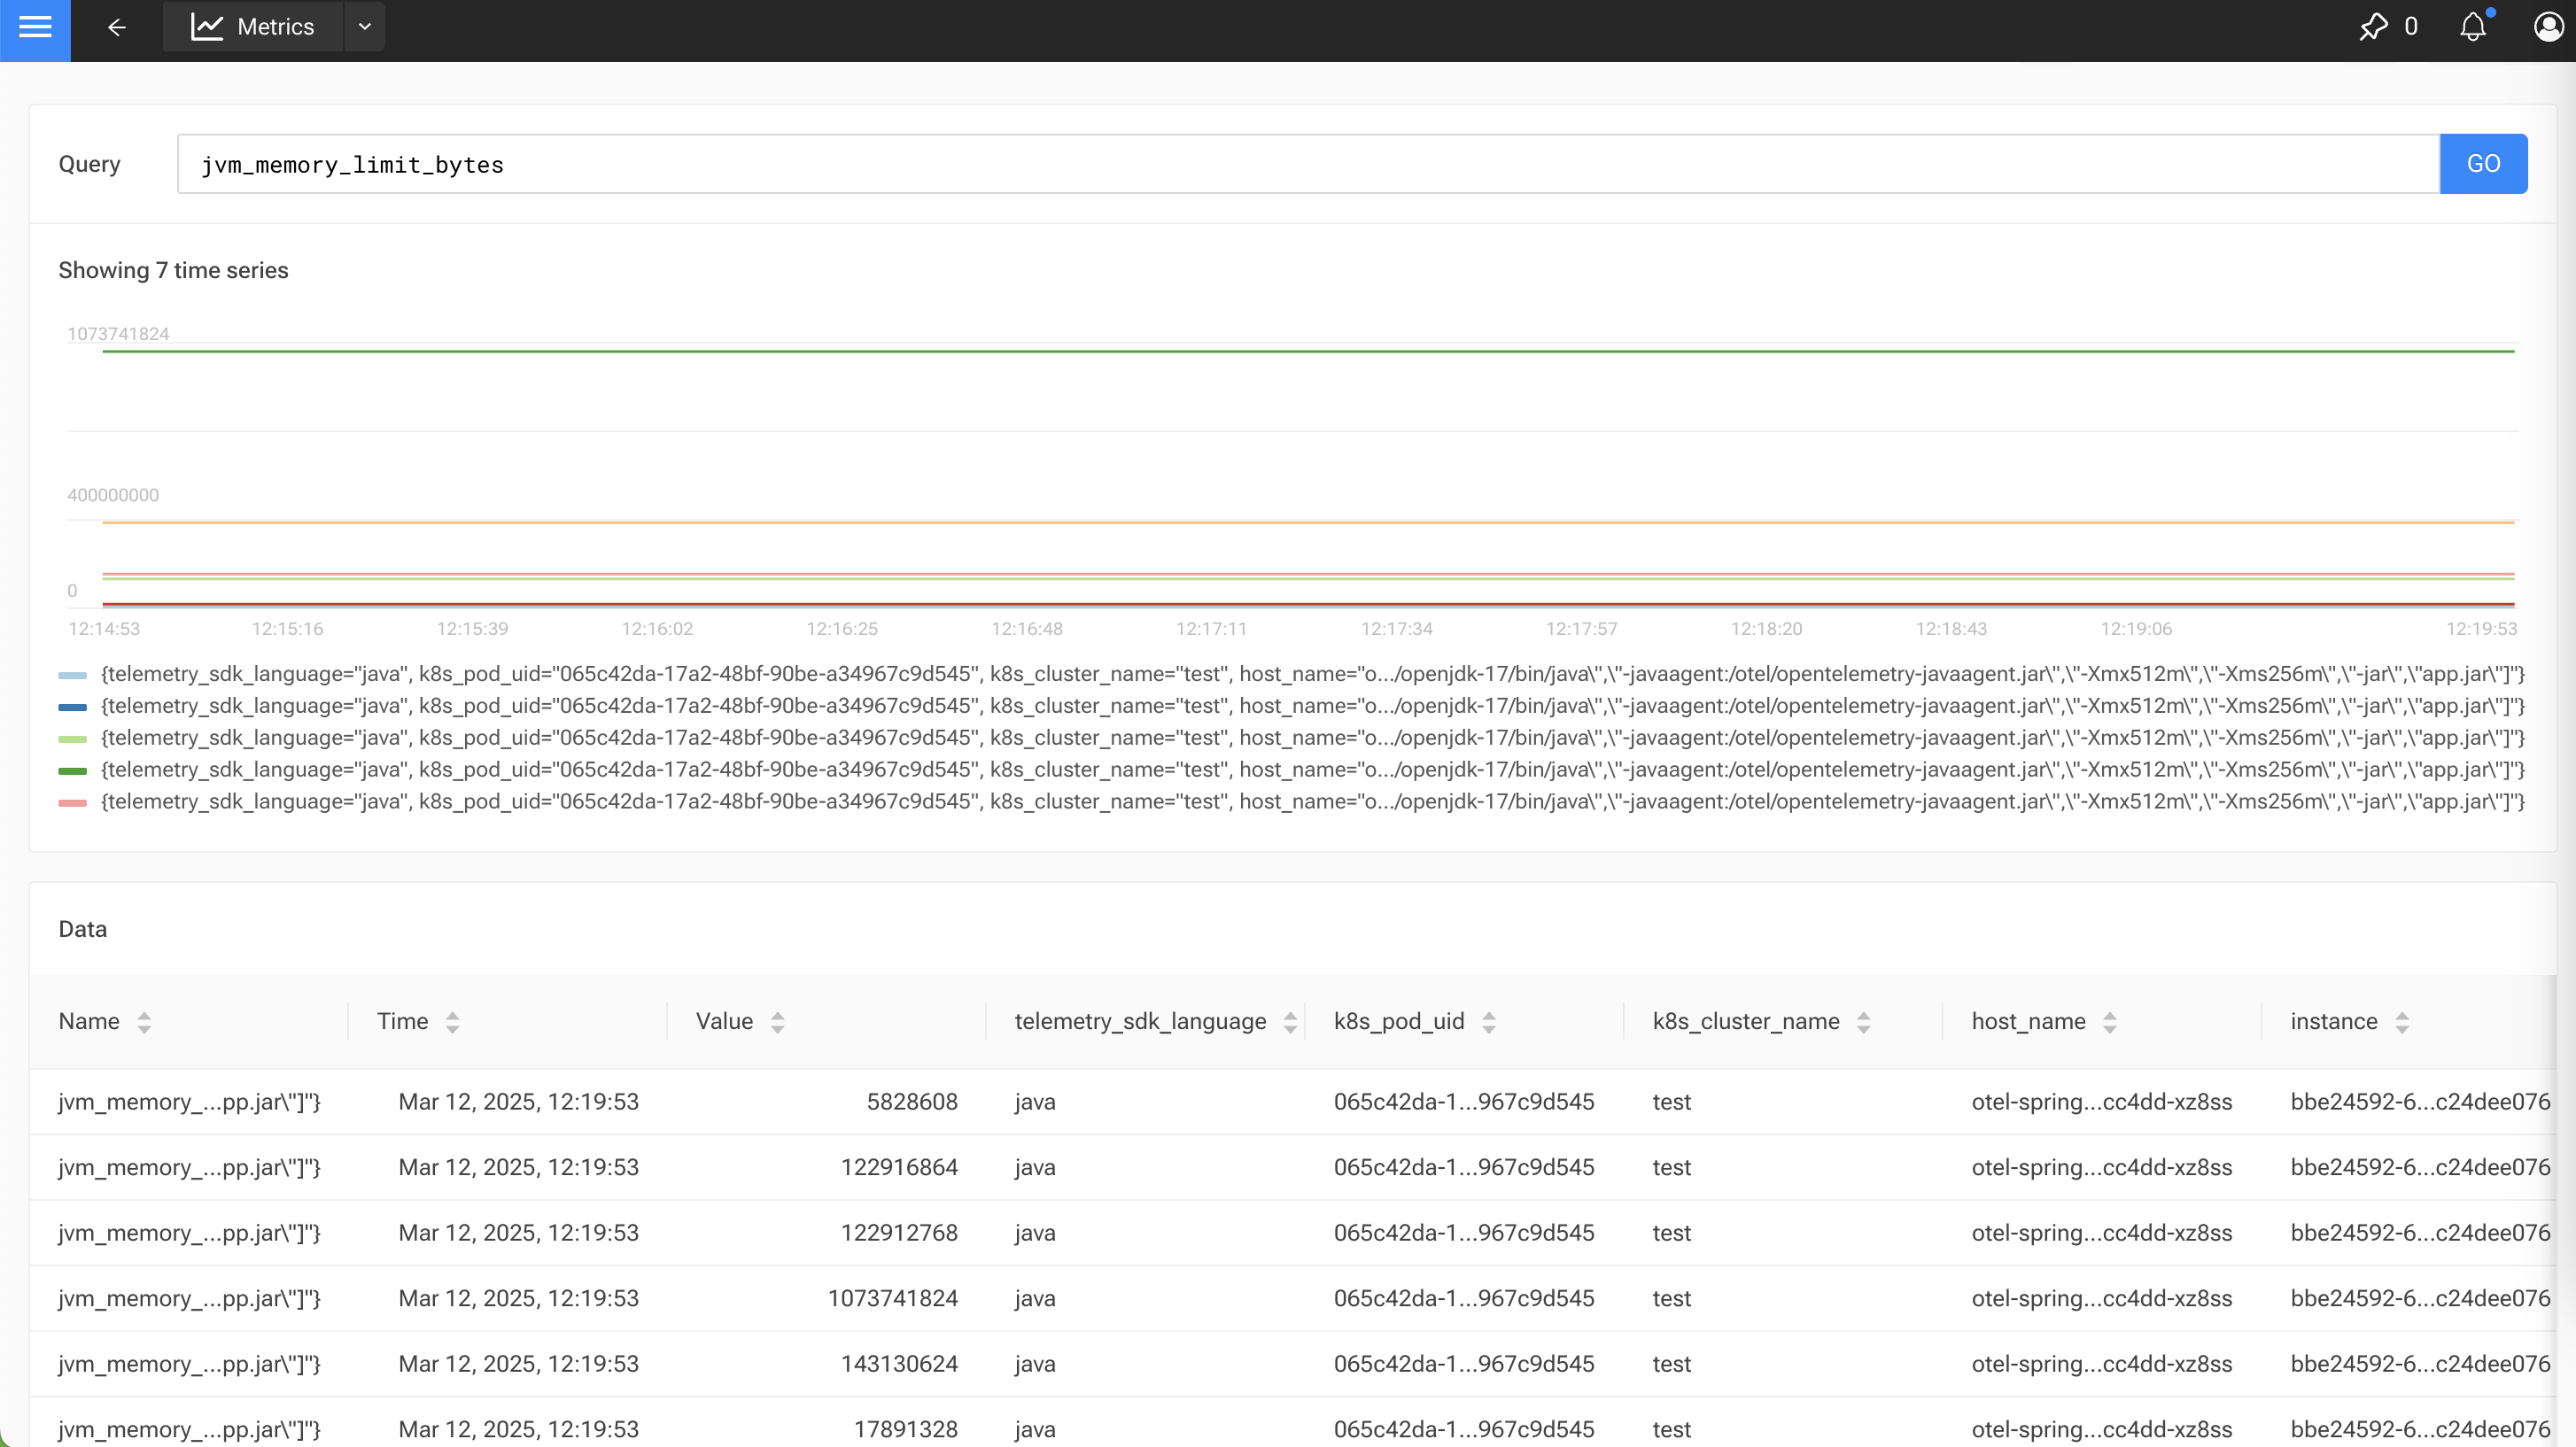
也会收集 Java 应用的 Metrics 数据:
Auto Instrumentation
可以通过 Operator 为 Spring Boot 自动注入相关环境变量和参数,参考文档:https://documentation.suse.com/cloudnative/suse-observability/latest/en/setup/otel/getting-started/getting-started-k8s-operator.html#_auto_instrumentation
创建 Instrumentation:
1
2
3
4
5
6
7
8
9
10
11
12
13
14
15
16
17
18
19
20
21
22
23
24
25
26
27
| cat <<EOF | kubectl apply -f -
apiVersion: opentelemetry.io/v1alpha1
kind: Instrumentation
metadata:
name: otel-instrumentation
namespace: open-telemetry
spec:
exporter:
endpoint: http://otel-collector-collector.open-telemetry.svc.cluster.local:4317
propagators:
- tracecontext
- baggage
defaults:
useLabelsForResourceAttributes: true
python:
env:
- name: OTEL_EXPORTER_OTLP_ENDPOINT
value: http://otel-collector-collector.open-telemetry.svc.cluster.local:4318
dotnet:
env:
- name: OTEL_EXPORTER_OTLP_ENDPOINT
value: http://otel-collector-collector.open-telemetry.svc.cluster.local:4318
go:
env:
- name: OTEL_EXPORTER_OTLP_ENDPOINT
value: http://otel-collector-collector.open-telemetry.svc.cluster.local:4318
EOF
|
创建完成后,只需要给 Spring Boot 应用添加一个 annotation,即可完成自动注入,本质上就是 Operator 自动给 Pod 添加了 initContainers 和相关的环境变量:
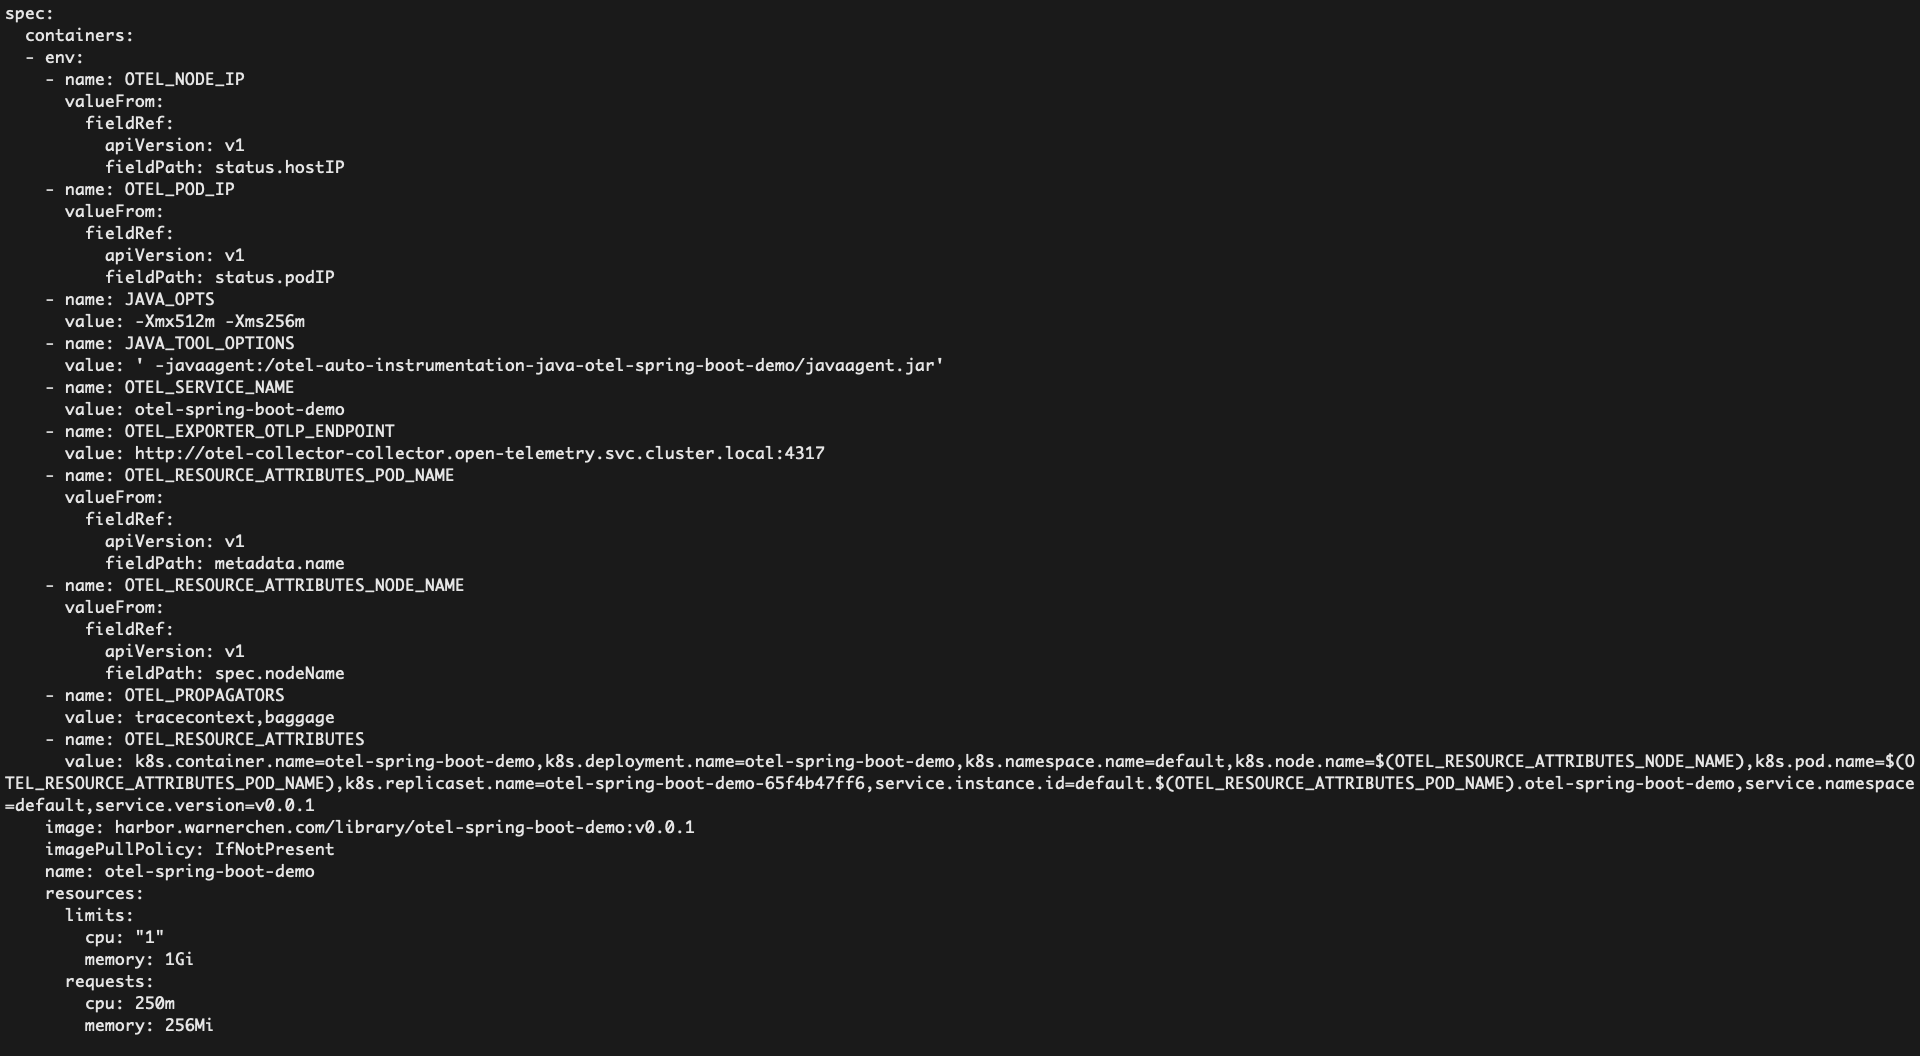
使用 deploy/deployment-auto-instrumentation.yaml、deploy/service.yaml 部署后效果如下:
SDK
待补充。
Rancher 对接 SUSE Observability
在 Rancher 对接 SUSE Observability,URL 需要使用证书。
在 SUSE Observability -> CLI 页面,获取 CLI 工具安装命令:
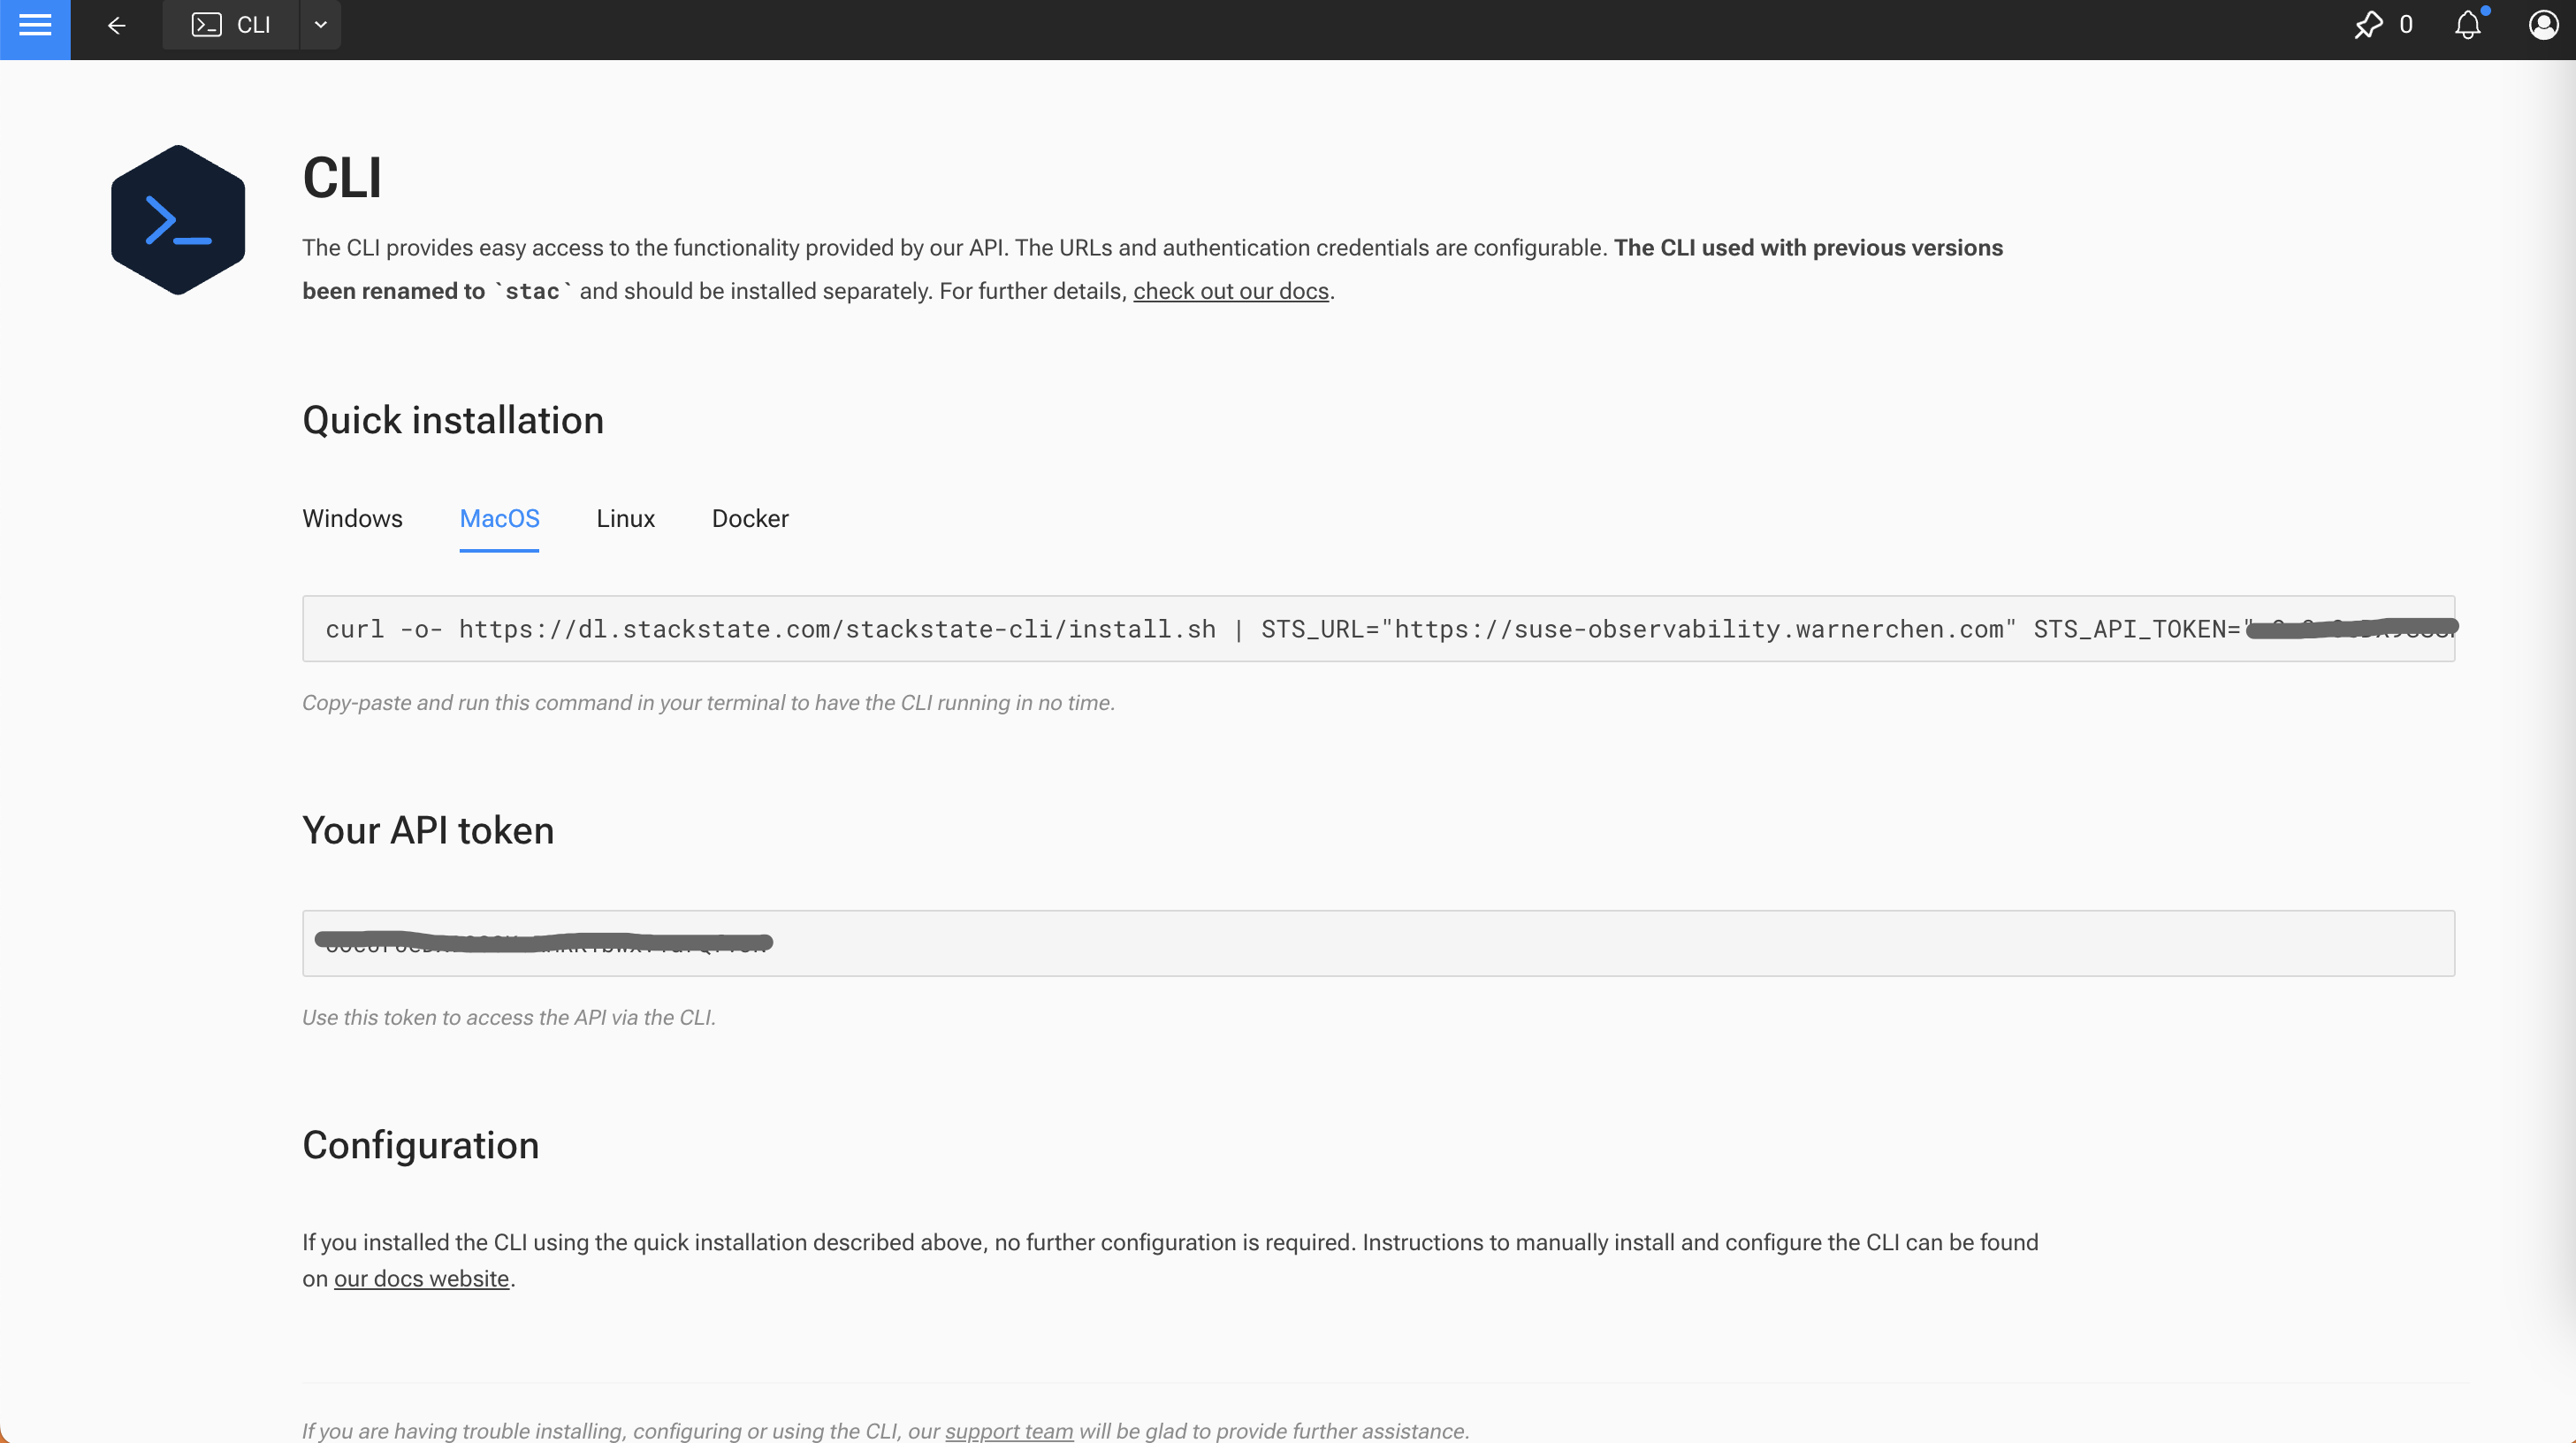
通过 CLI 安装 sts 工具获取 Service Token,后续用于 Rancher 对接 SUSE Observability:
1
2
3
4
5
6
7
| curl -o- https://dl.stackstate.com/stackstate-cli/install.sh | STS_URL="https://suse-observability.warnerchen.com" STS_API_TOKEN="xxx" bash
sts version
sts service-token create --name suse-observability-extension --roles stackstate-k8s-troubleshooter
sts context list
|
也可以手动安装 CLI,然后准备配置文件:
1
2
3
4
5
6
7
8
9
10
11
12
13
14
15
16
17
18
19
20
| (VERSION=`curl https://dl.stackstate.com/stackstate-cli/LATEST_VERSION` && VERSION=${VERSION#v} &&
curl https://dl.stackstate.com/stackstate-cli/v$VERSION/stackstate-cli-$VERSION.linux-x86_64.tar.gz | tar xz --directory /usr/local/bin)
sts version
mkdir -pv .config/stackstate-cli
cat <<EOF > .config/stackstate-cli/config.yaml
contexts:
- name: default
context:
url: https://suse-observability.warnerchen.com
api-token: xxx
api-path: /api
admin-api-path: ""
skip-ssl: true
current-context: default
EOF
sts context list
|
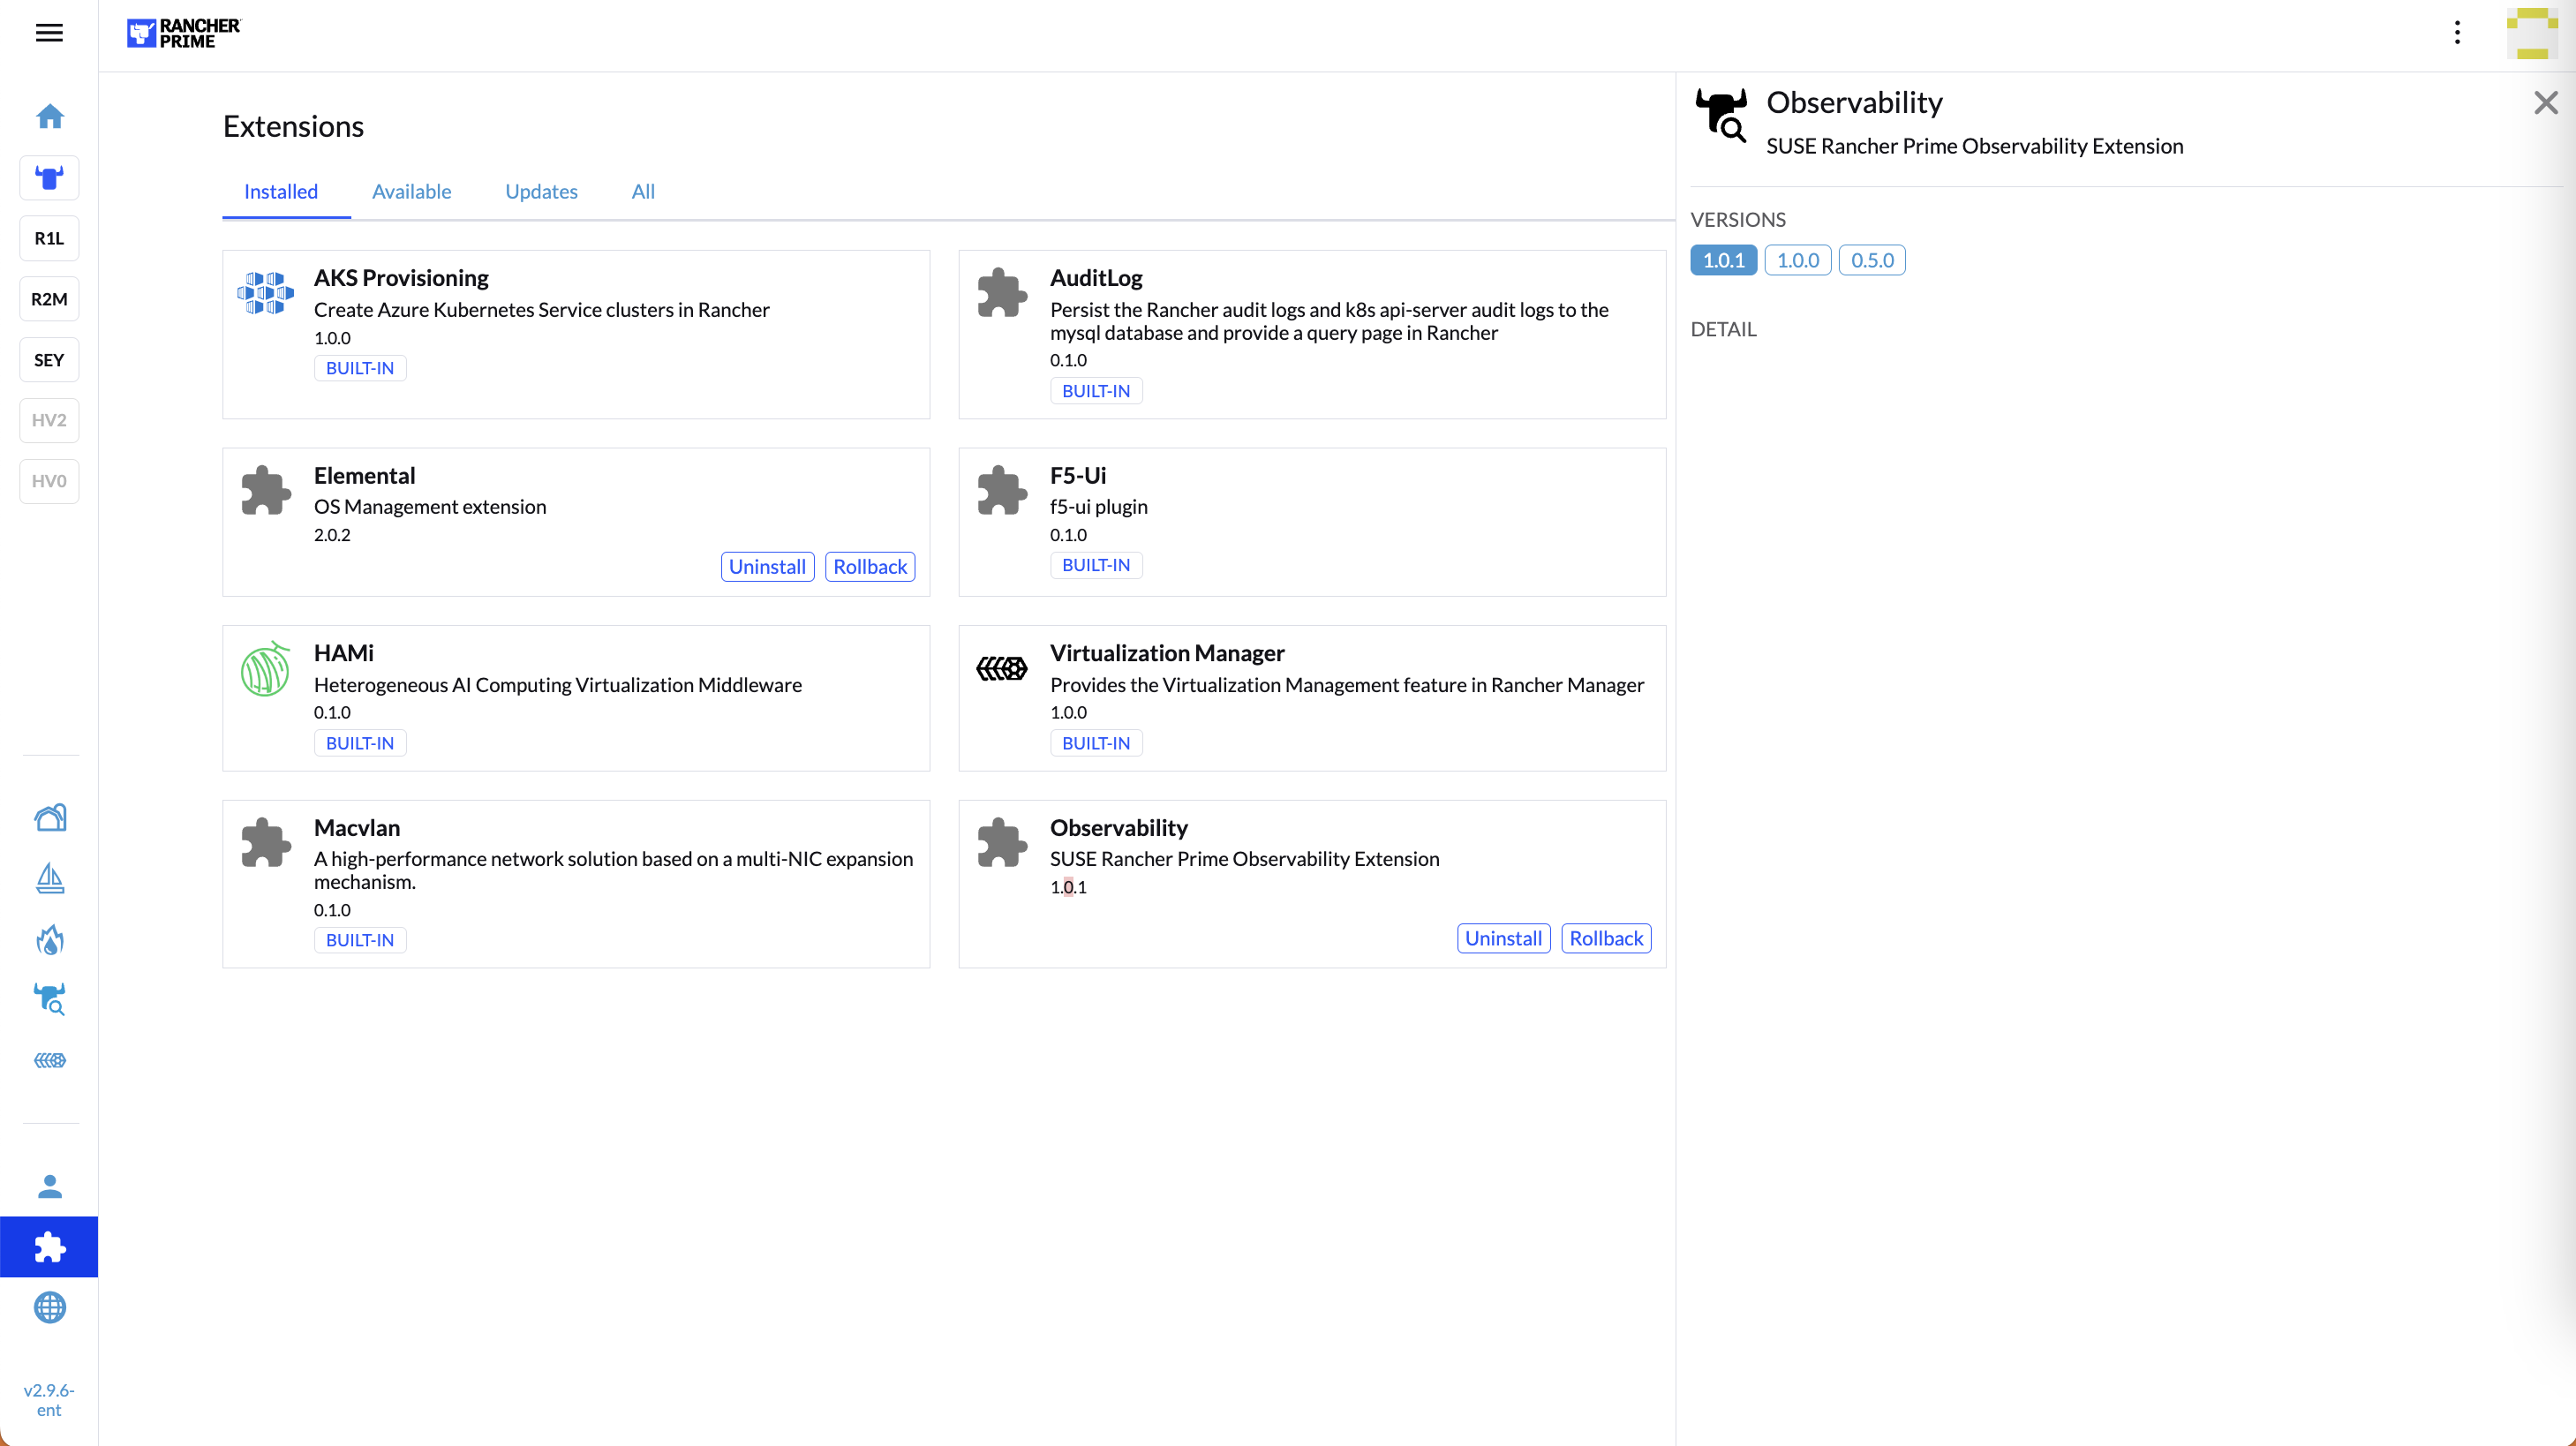
在 Rancher Extensions 中安装 Observability:
进行对接:
如果 SUSE O11y Ingress 使用的是私有 CA 下发的证书,那么需要配置 Rancher 信任该 CA:https://ranchermanager.docs.rancher.com/getting-started/installation-and-upgrade/installation-references/helm-chart-options#additional-trusted-cas
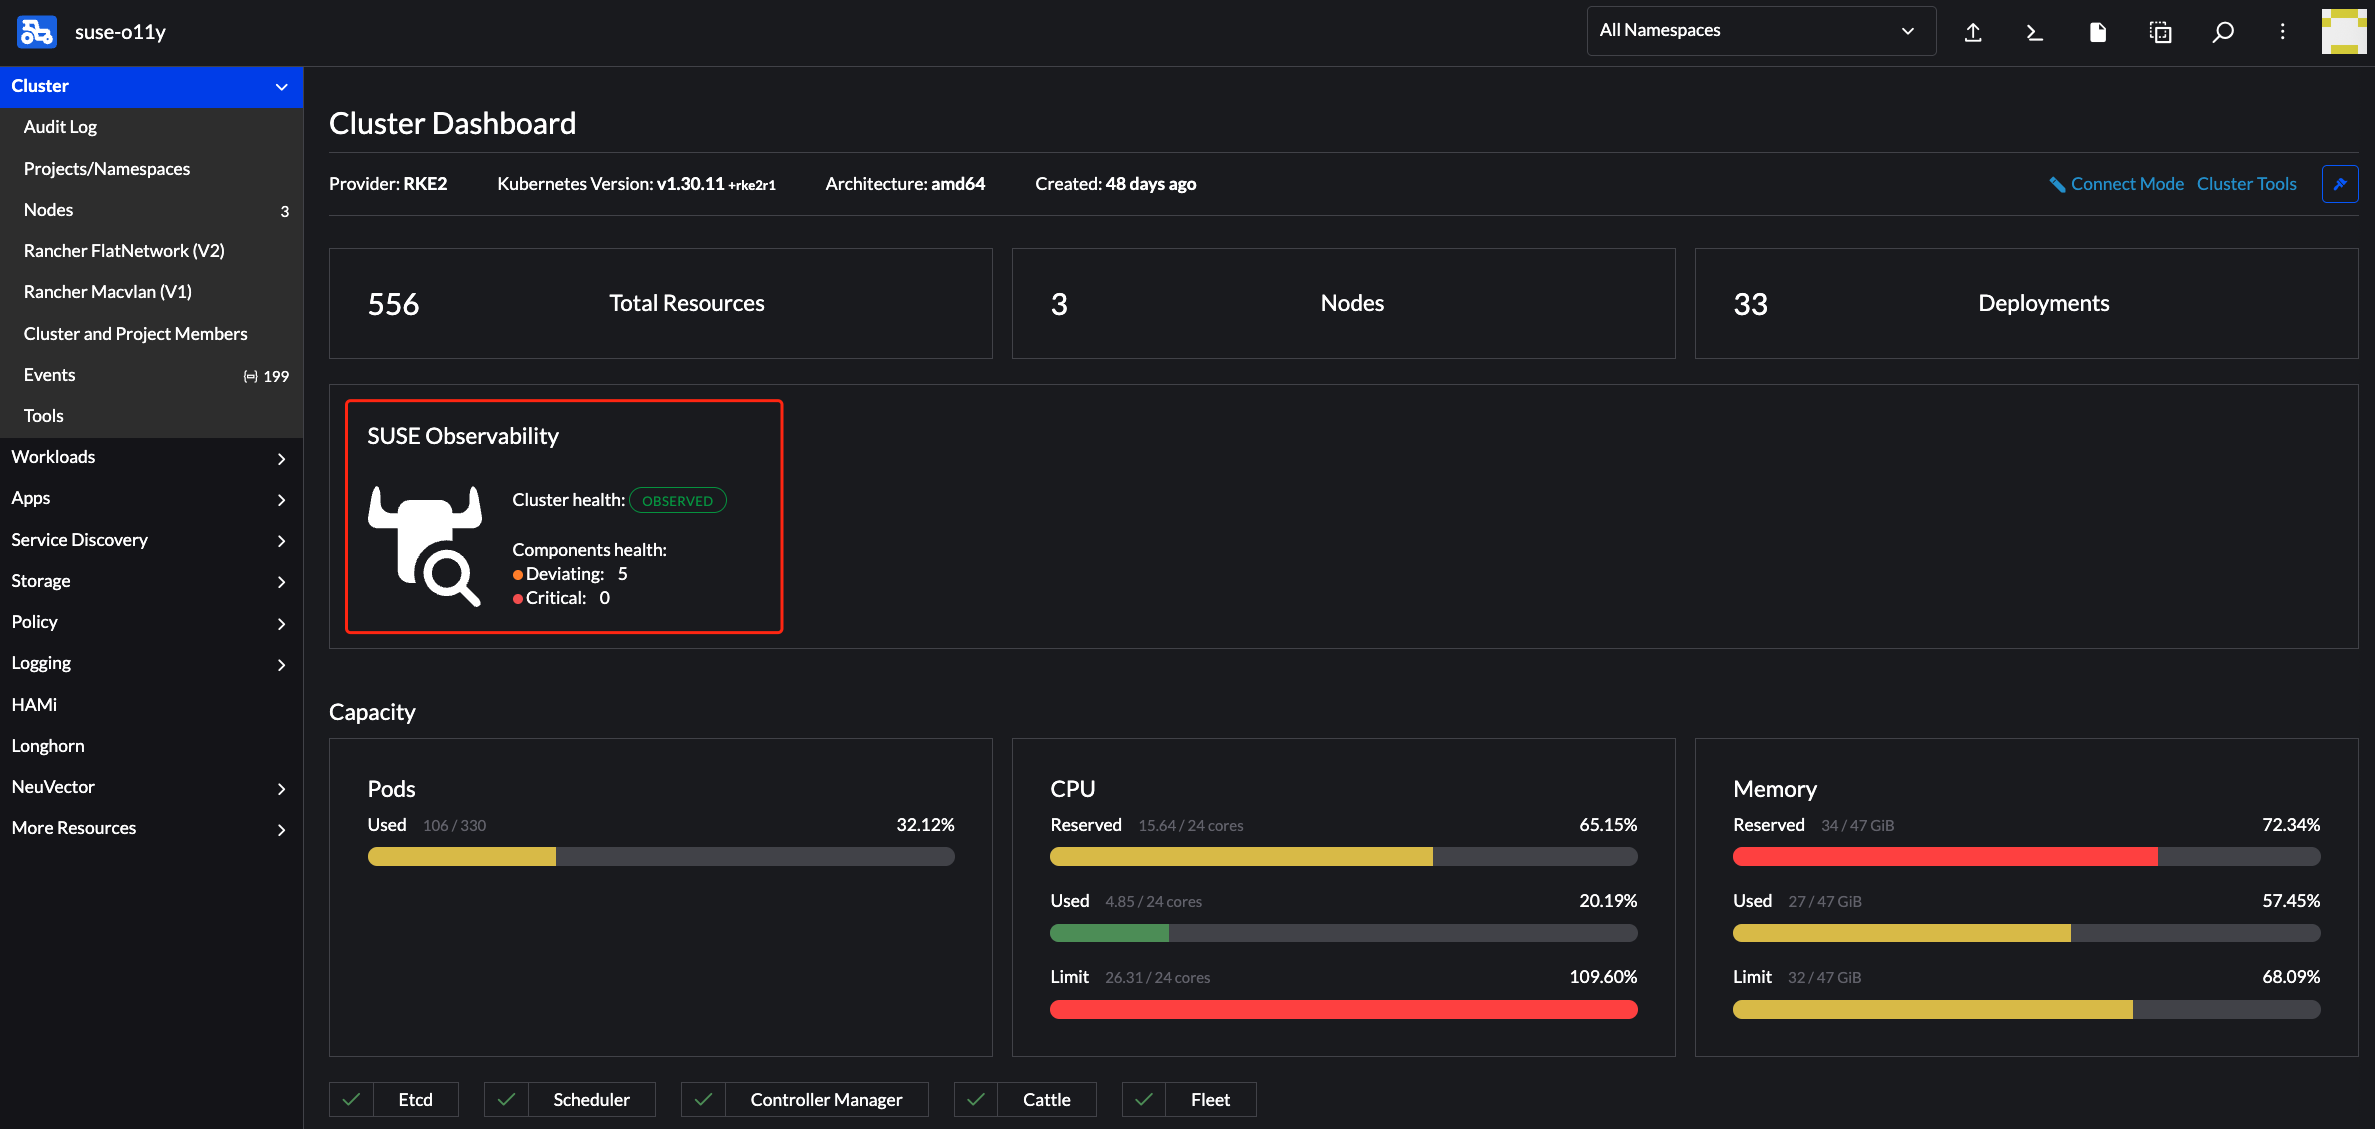
对接成功后,即可在 Rancher 查看 SUSE O11y 的 Dashboard:
创建自定义 Dashboard
准备 MetricBinding 配置文件:
1
2
3
4
5
6
7
8
9
10
11
12
13
14
15
| cat <<EOF > custom_cpu_usage_dashboard.yaml
nodes:
- _type: MetricBinding
chartType: line
enabled: true
tags: {}
unit: short
name: Custom CPU Usage Dashboard
priority: MEDIUM
identifier: urn:custom:metric-binding:custom-cpu-usage
queries:
- expression: sum(rate(container_cpu_usage{namespace="\${name}"}[5m]))
alias: custom_cpu_usage
scope: label = "stackpack:kubernetes" and type = "namespace"
EOF
|
1
2
3
4
5
6
7
8
9
10
11
12
13
14
15
| cat <<EOF > custom_memory_usage_dashboard.yaml
nodes:
- _type: MetricBinding
chartType: line
enabled: true
tags: {}
unit: short
name: Custom Memory Usage Dashboard
priority: MEDIUM
identifier: urn:custom:metric-binding:custom-memory-usage
queries:
- expression: sum(container_memory_usage{namespace="\${name}"})
alias: custom_memory_usage
scope: label = "stackpack:kubernetes" and type = "namespace"
EOF
|
应用配置:
1
2
3
4
5
6
7
8
9
10
11
| root@test-0:~# sts settings apply -f custom_cpu_usage_dashboard.yaml --skip-ssl
✅ Applied 1 setting node(s).
TYPE | ID | IDENTIFIER | NAME
MetricBinding | 179068077054476 | urn:custom:metric-binding:custom-cpu-usage | Custom CPU Usage Dashboard
root@test-0:~# sts settings apply -f custom_memory_usage_dashboard.yaml --skip-ssl
✅ Applied 1 setting node(s).
TYPE | ID | IDENTIFIER | NAME
MetricBinding | 185753189906469 | urn:custom:metric-binding:custom-memory-usage | Custom Memory Usage Dashboard
|
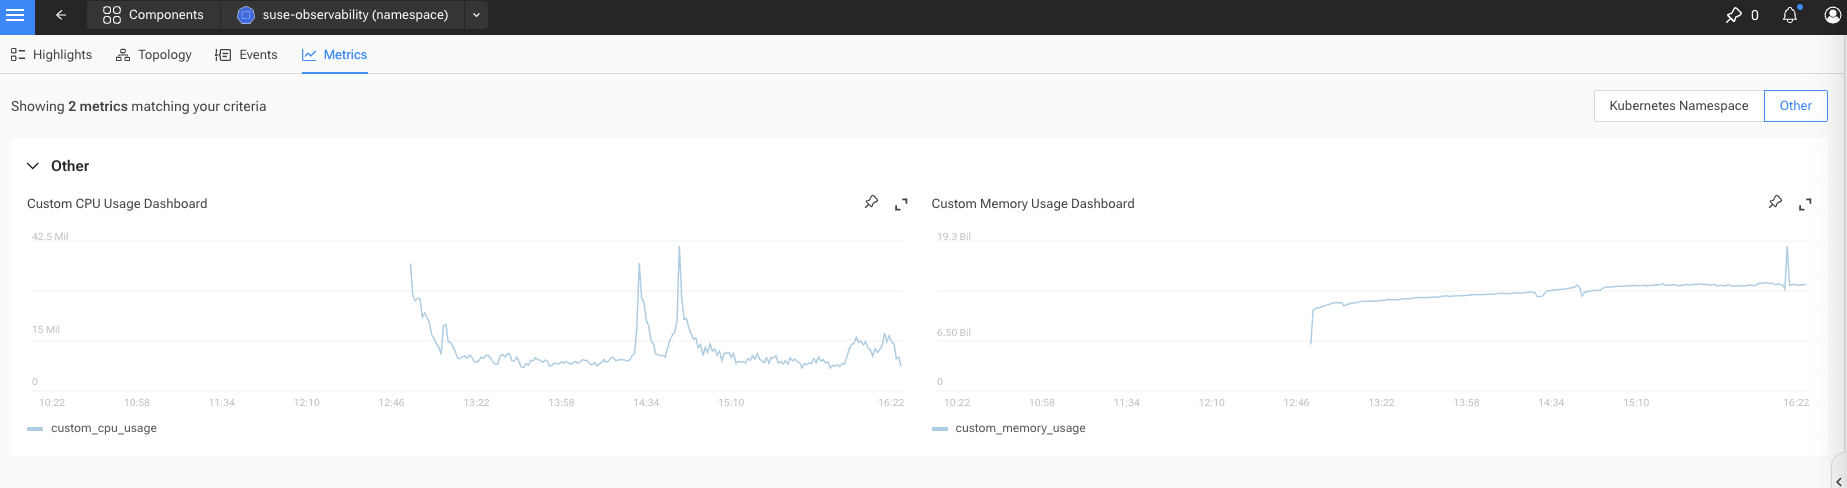
在 Other 下,即可看到自定义的 Dashboard:
获取所有 MetricBinding:
1
| sts settings list --type MetricBinding
|
删除 MetricBinding:
1
2
| sts settings delete --ids 179068077054476
sts settings delete --ids 185753189906469
|
Troubleshooting
官方文档:https://documentation.suse.com/cloudnative/suse-observability/latest/en/use/troubleshooting/k8s-guided-troubleshooting.html
检查 Kafka Topics
当启用 JMX exporter 时,Kafka 容器中的 JMX 端口会被设置为 5555,jmx-exporter sidecar 使用该端口来收集指标,并通过端口 5556 对外暴露这些指标。Kafka 的命令行工具也会使用相同的环境变量(JMX_PORT),因此它们会尝试打开为 Server 配置的端口。
相关 Issue:https://github.com/bitnami/charts/issues/12917
所以如果要使用 kafka-topics.sh 等命令,需要启动一个临时的 Client Pod:
1
| kubectl run kafka-client --restart='Never' -it --image <kafka_image> --namespace suse-observability --command -- bash
|
1
2
3
4
5
6
7
8
9
10
11
12
| I have no name!@kafka-client:/$ kafka-topics.sh --bootstrap-server suse-observability-kafka-0.suse-observability-kafka-headless.suse-observability.svc.cluster.local:9092 --list
__consumer_offsets
sts_correlate_endpoints
sts_correlate_http_trace_observations
sts_correlated_connections
sts_health_sync
sts_health_sync_settings
sts_intake_health
sts_internal_events
sts_internal_topology
sts_topo_process_agents
sts_topology_events
|