Rancher Monitoring Grafana 出现 504 错误
Rancher Monitoring V2 中,Grafana 通过 Nginx 作为反向代理(grafana-proxy)访问 Prometheus。当 Grafana 执行 PromQL 查询且返回数据量较大(例如查询时间范围较长)时,Prometheus 可能无法在 Nginx 的超时时间内完成响应,从而导致 Grafana 返回 504 Gateway Timeout 错误:
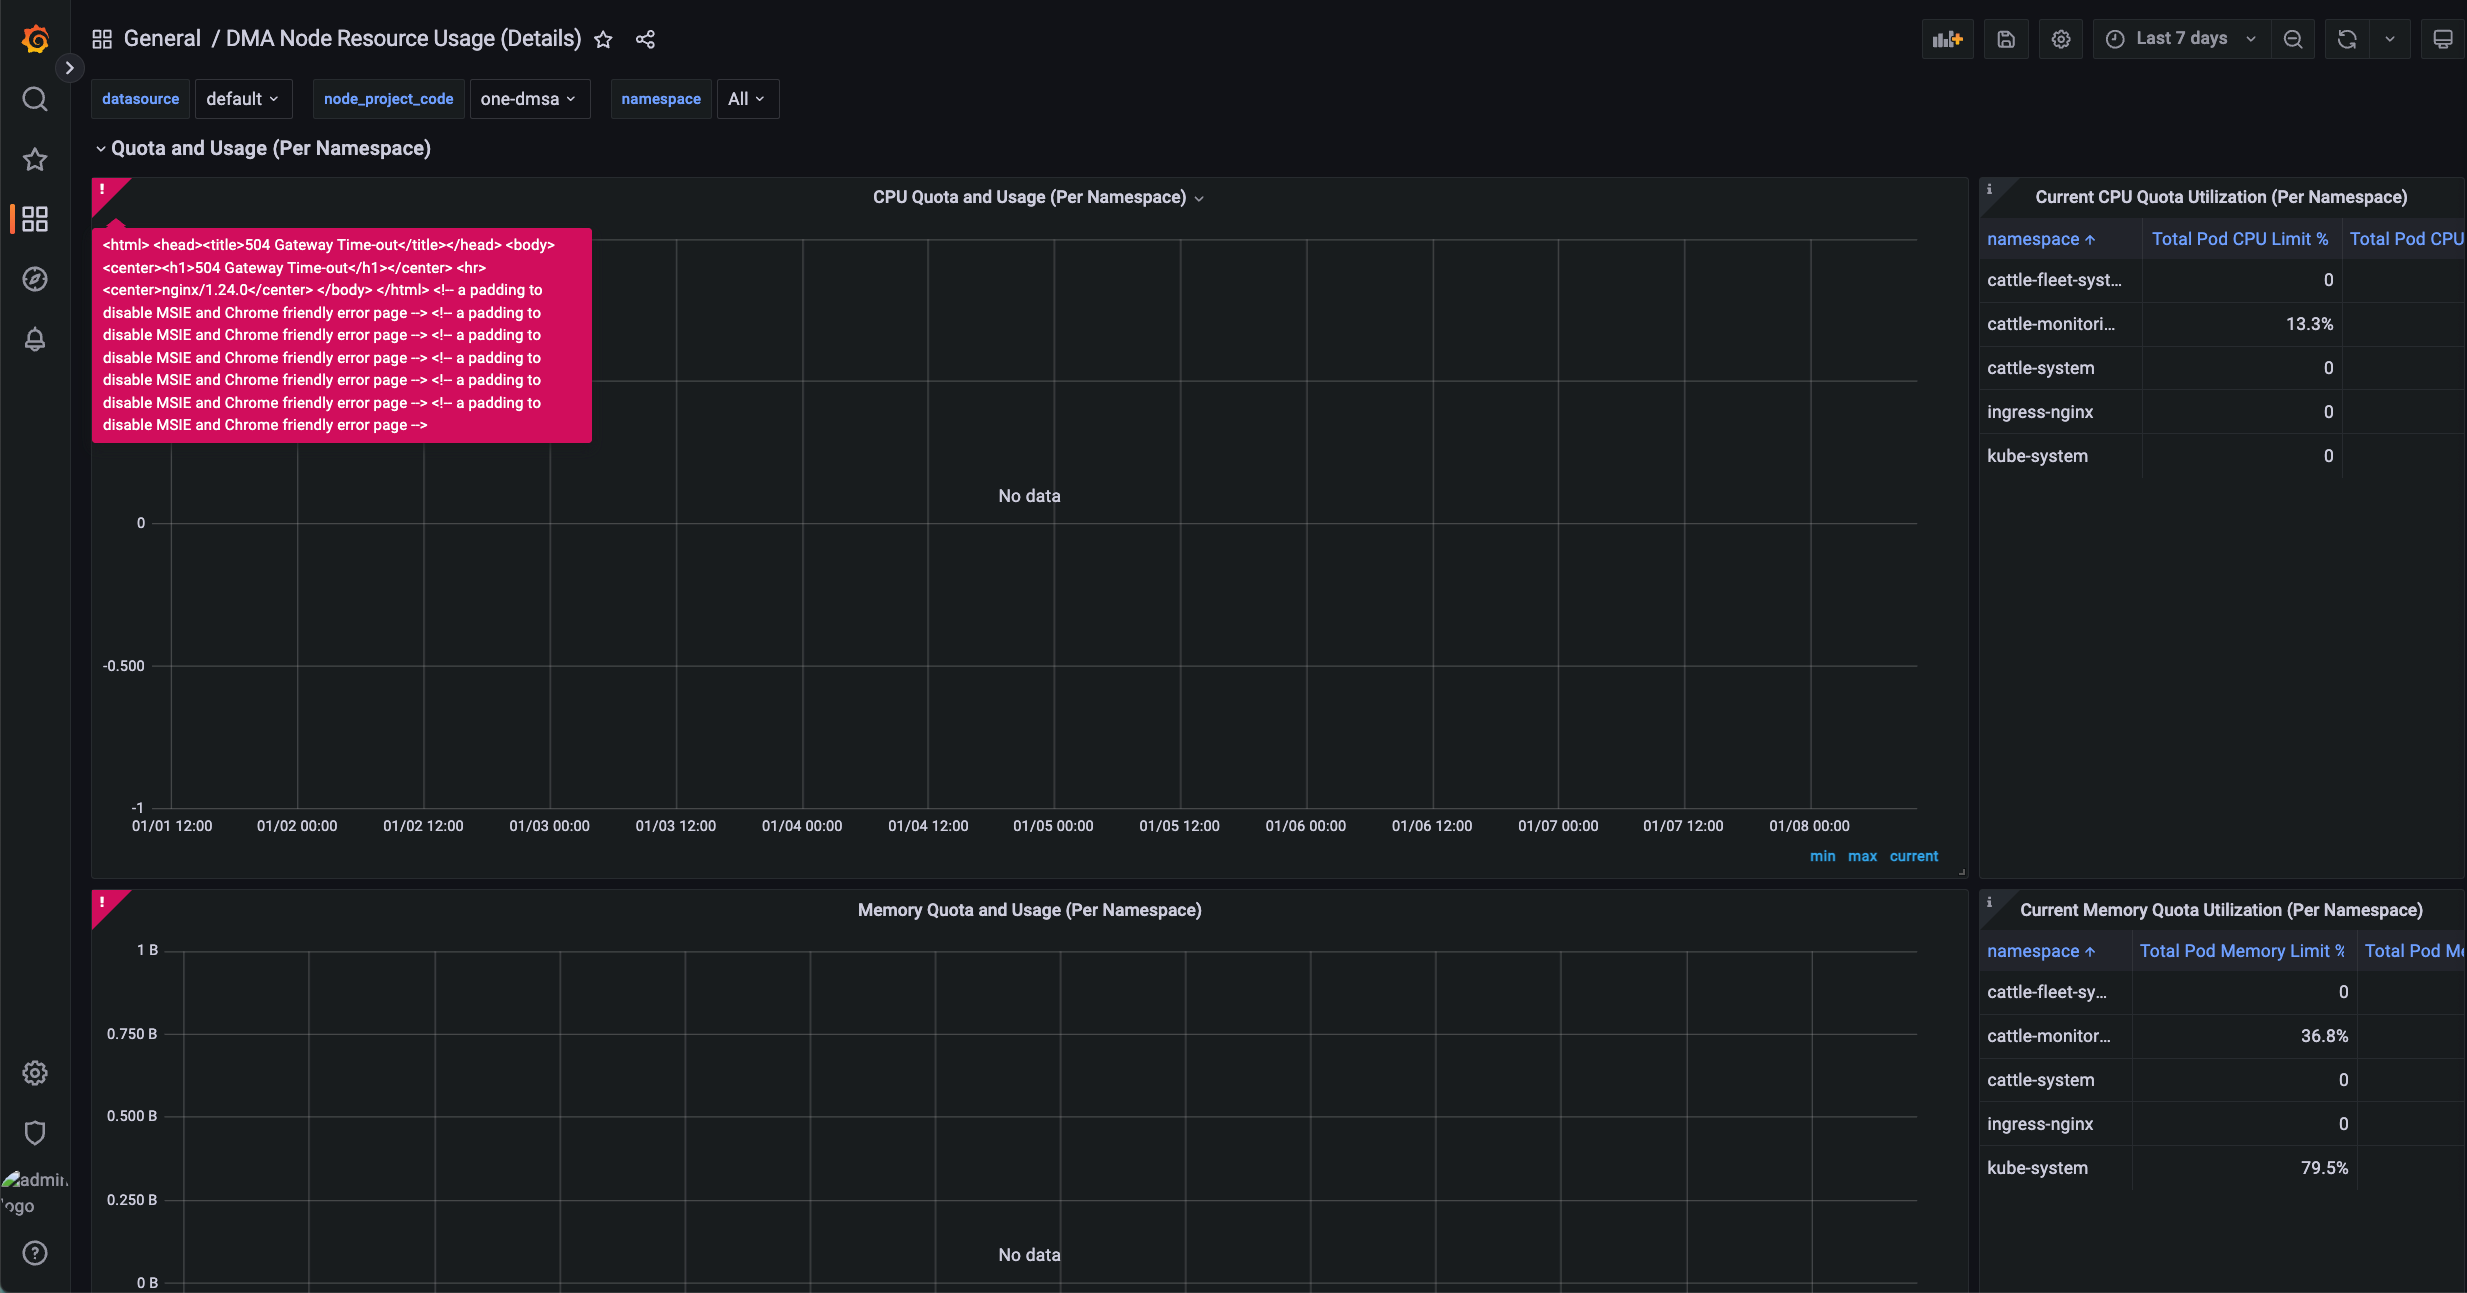
在 Grafana Proxy 可以看到报错:
1 | 2025-12-29T08:44:32.116099293Z 2025/12/29 08:44:32 [error] 23#23: *18075 upstream timed out (110: Operation timed out) while reading response header from upstream, client: 10.42.28.0, server: , request: "POST /api/ds/query?ds_type=prometheus&requestId=Q103 HTTP/1.1", upstream: "http://127.0.0.1:3000/api/ds/query?ds_type=prometheus&requestId=Q103", host: "test.com", referrer: "https://test.com/k8s/clusters/c-7cv44/api/v1/namespaces/cattle-monitoring-system/services/http:rancher-monitoring-grafana:80/proxy/d/df8jf0nirw45ca/dma-node-resource-usage-debug-details?orgId=1" |
这是因为 Grafana 使用的 Nginx 代理中,proxy_read_timeout 默认设置为 3 分钟,部分耗时较长的查询在该时间内无法完成,导致请求超时。适当调大 proxy_read_timeout,并重启 Grafana 后即可解决:
1 | # ConfigMap grafana-nginx-proxy-config |
目前 Rancher Monitoring V2 无法在 values.yaml 中对 Nginx 配置进行高度自定义,所以执行 helm upgrade 等操作后,需要重新配置。
Rancher Monitoring Grafana 出现 504 错误
https://warnerchen.github.io/2026/01/09/Rancher-Monitoring-Grafana-出现-504-错误/
You need to set
install_url to use ShareThis. Please set it in _config.yml.