Rancher Monitoring Kubernetes Dashboard 显示 No Data 排查记录
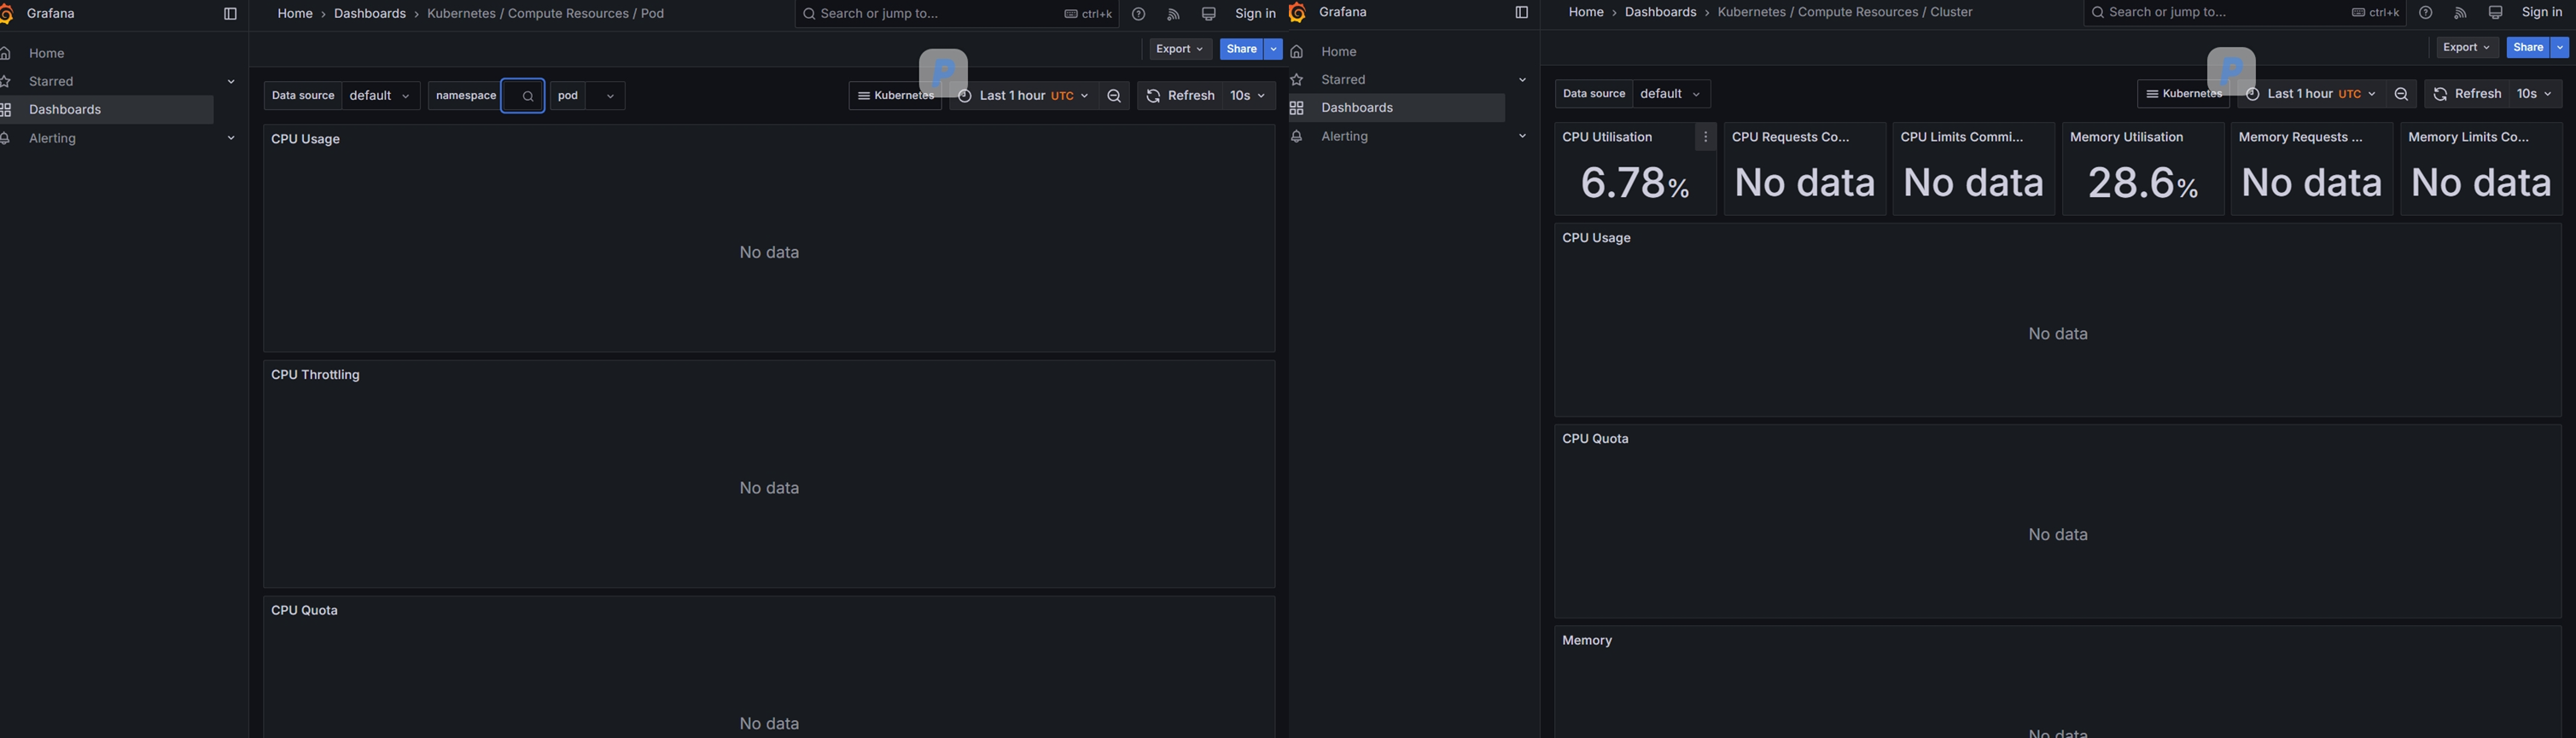
在 local 集群中安装 Rancher Monitoring 后,Grafana 中查看 Kubernetes 下的 Dashboard 显示 No data:
- Kubernetes / Compute Resources / Pod
- Kubernetes / Compute Resources / Cluster
- Kubernetes / Compute Resources / Workload
与此同时,Rancher 下的 Pod、Node 等 Dashboard 能正常显示数据。
最终确认这不是 kube-state-metrics、kubelet 或 Prometheus Recording Rules 故障,而是以下三项配置叠加造成的标签污染:
- 下游集群
test-k8s的 Prometheus 配置了externalLabels.cluster=test-k8s; local集群手工创建了ScrapeConfig/prometheus-federation,通过/federate获取下游集群指标;- federation 的
match[]包含所有up指标,而 Rancher 内置 Dashboard 又使用up生成隐藏的$cluster变量。
结果:Grafana 把 $cluster 解析成了 test-k8s,随后用这个远端集群标签过滤没有 cluster 标签的 local 指标,最终得到空结果。
环境信息
- Rancher:v2.11.3
- Rancher Monitoring Helm Chart:
106.1.4_up69.8.2-rancher.23
故障现象
Kubernetes 下 Pod、Cluster、Workload 等 Dashboard 的多数面板显示 No data,部分变量也无法选择 Namespace、Pod 或 Workload:
排查过程
排除 kube-state-metrics 故障
在 local 集群的 Prometheus 中查看 kube-state-metrics 的 target 状态,显示正常:
1 | up{job="kube-state-metrics"} |
查询 kube-state-metrics 的实际业务指标:
1 | count by (job, service, namespace) ( |
各 namespace 都能返回 Pod 数量,因此可以排除:
- kube-state-metrics Pod 不健康
- ServiceMonitor 没有发现 target
- kube-state-metrics RBAC 无法读取 Kubernetes API
- Prometheus 完全没有抓到 kube-state-metrics 指标
不过,在查看 up 的完整标签时发现了异常:同一个 job="kube-state-metrics" 中,有的指标带有 cluster="test-k8s",有的没有 cluster;带 cluster 的指标还出现了 prometheus 和 prometheus_replica 标签:
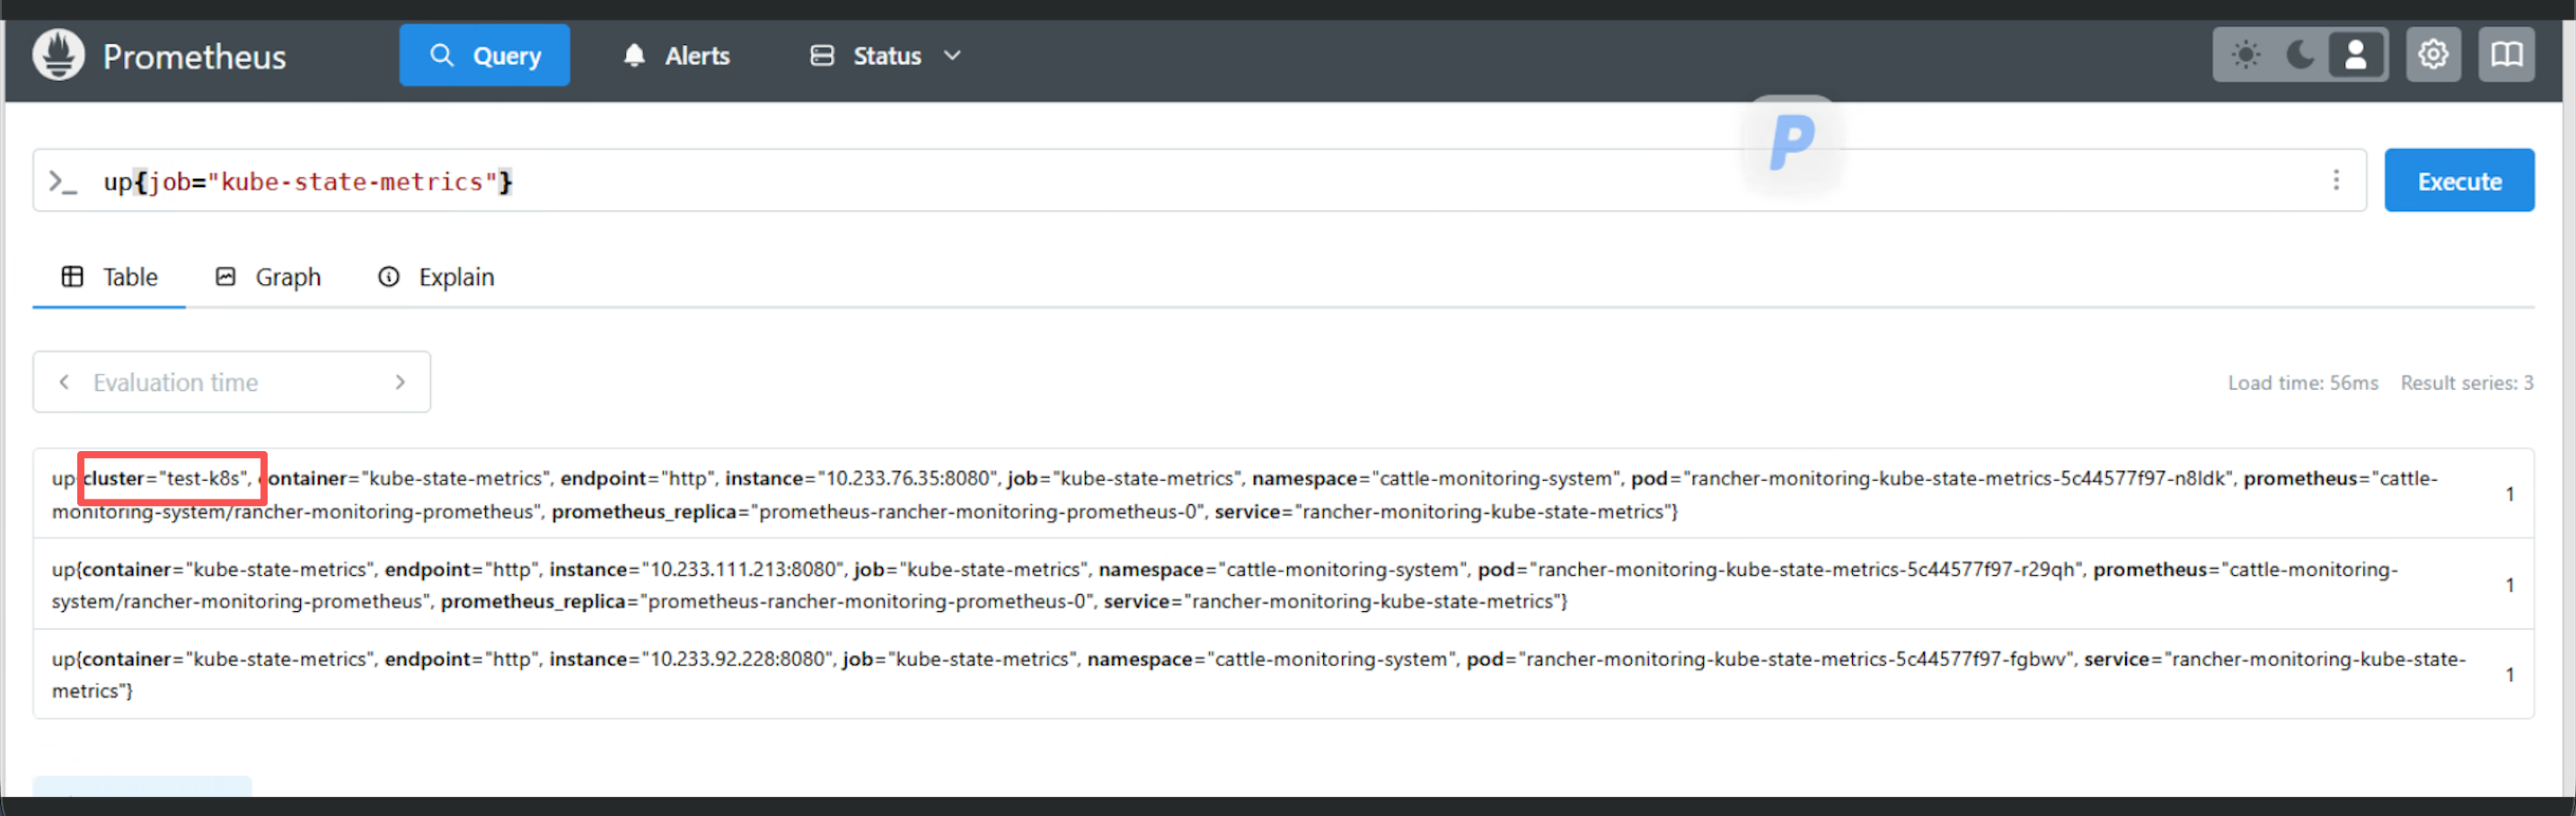
说明 local 集群的 Prometheus 中同时存在本地和其他 Prometheus 带入的指标。
按 cluster 标签检查指标
基于 cluster 标签进行如下查询:
1 | count by (cluster) ( |
1 | count by (cluster) ( |
1 | count by (cluster) ( |
1 | count by (cluster) ( |
这些查询都只返回:
1 | {} |
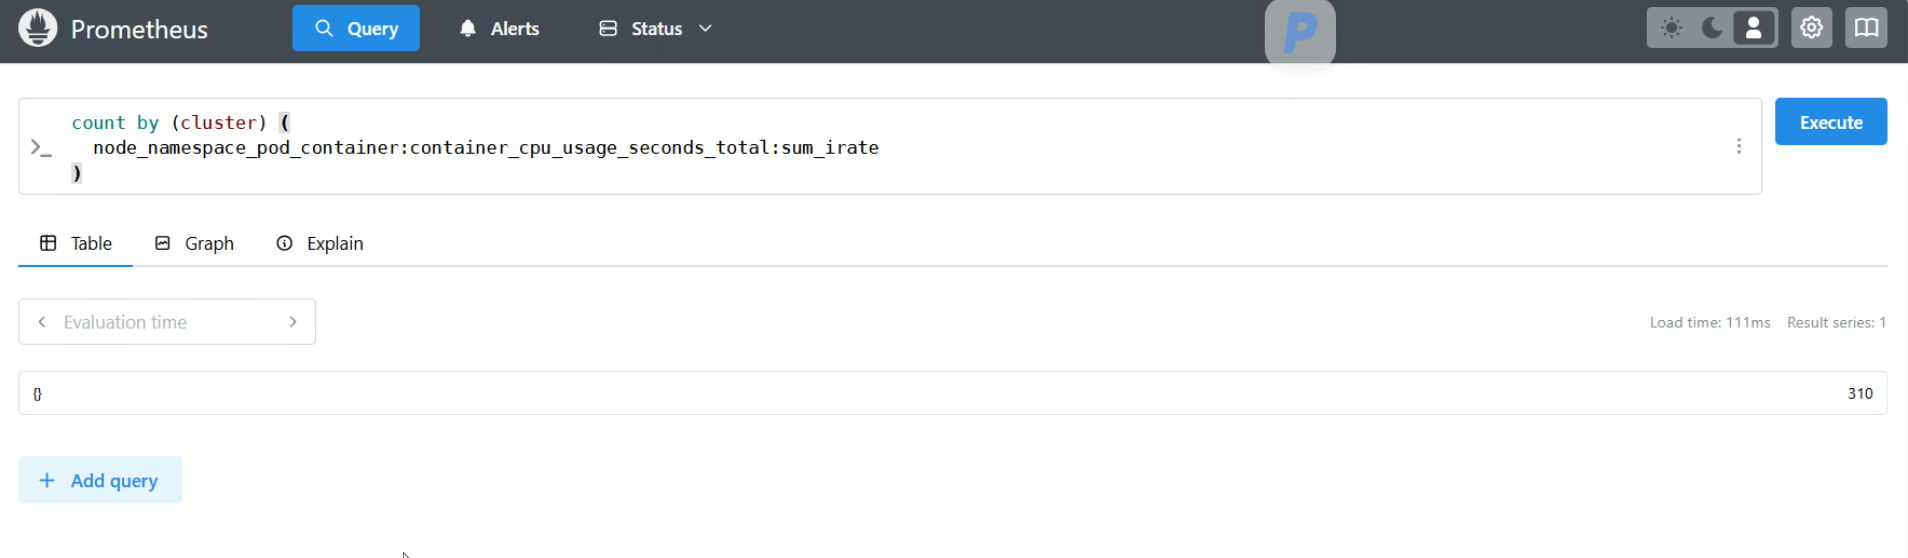
{} 表示指标上不存在 cluster 标签,而不是指标不存在。
在 PromQL 中 cluster="" 既可以匹配值为空的标签,也可以匹配根本不存在该标签的指标。因此下面的查询有数据:
1 | sum( |
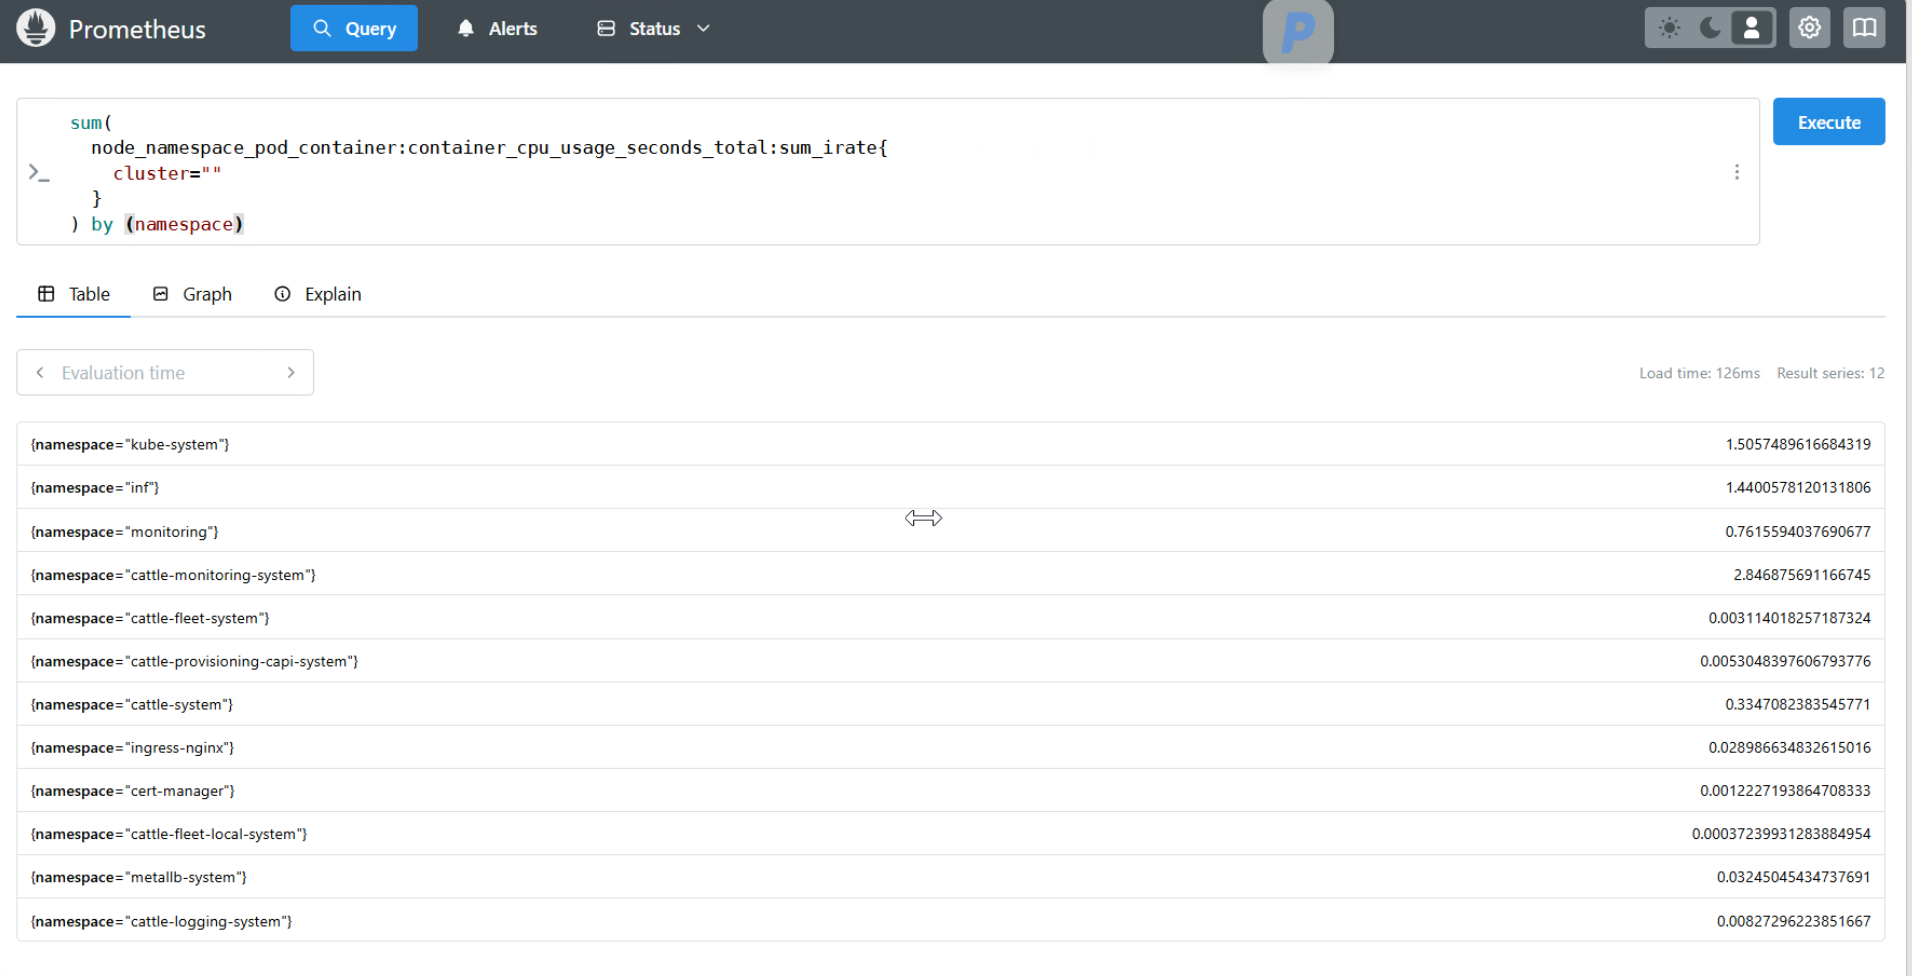
而下面的查询没有数据:
1 | sum( |
因此可以确认:真正的 local 集群指标没有 cluster="test-k8s"。
Grafana Query Inspector 查看查询条件
在 Grafana Panel 的 Inspect -> Query 中查看变量替换后的最终 PromQL,发现查询实际已经变成:
1 | node_namespace_pod_container:container_cpu_usage_seconds_total:sum_irate{ |
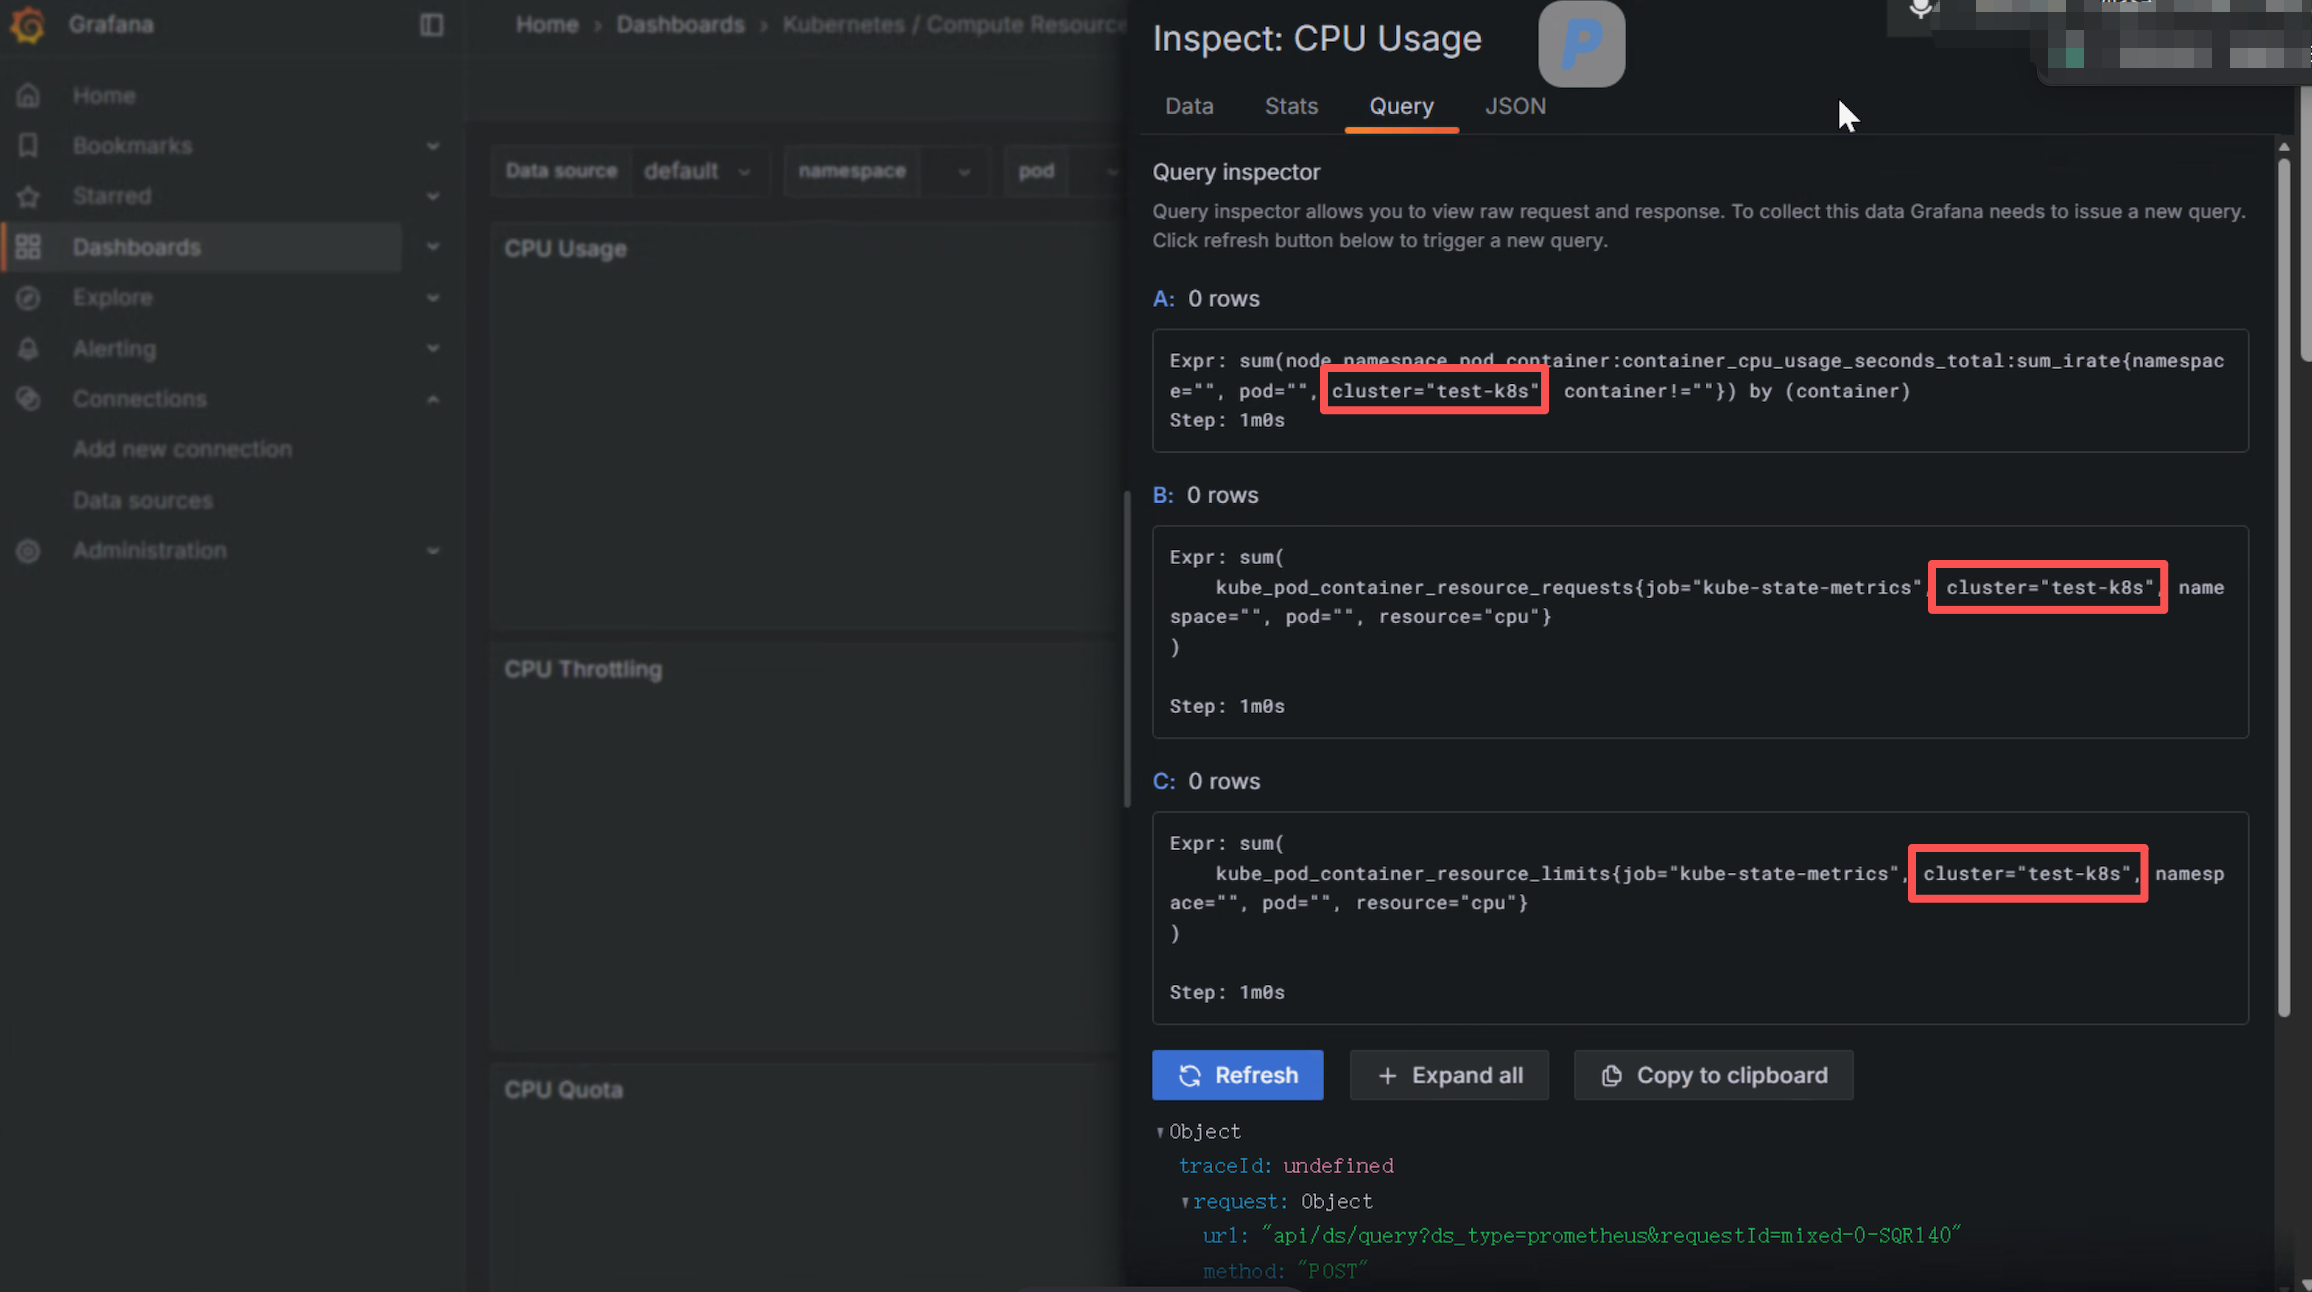
这也解释了为什么 Namespace 和 Pod 选项都为空:这些变量本身同样依赖 $cluster。一旦 $cluster 选错,后续变量查询也匹配不到数据,形成连锁反应。
确认 Dashboard 的 cluster 变量来源
Rancher Monitoring 内置 Kubernetes Dashboard 使用类似下面的变量查询:
1 | label_values(up{job="kube-state-metrics"}, cluster) |
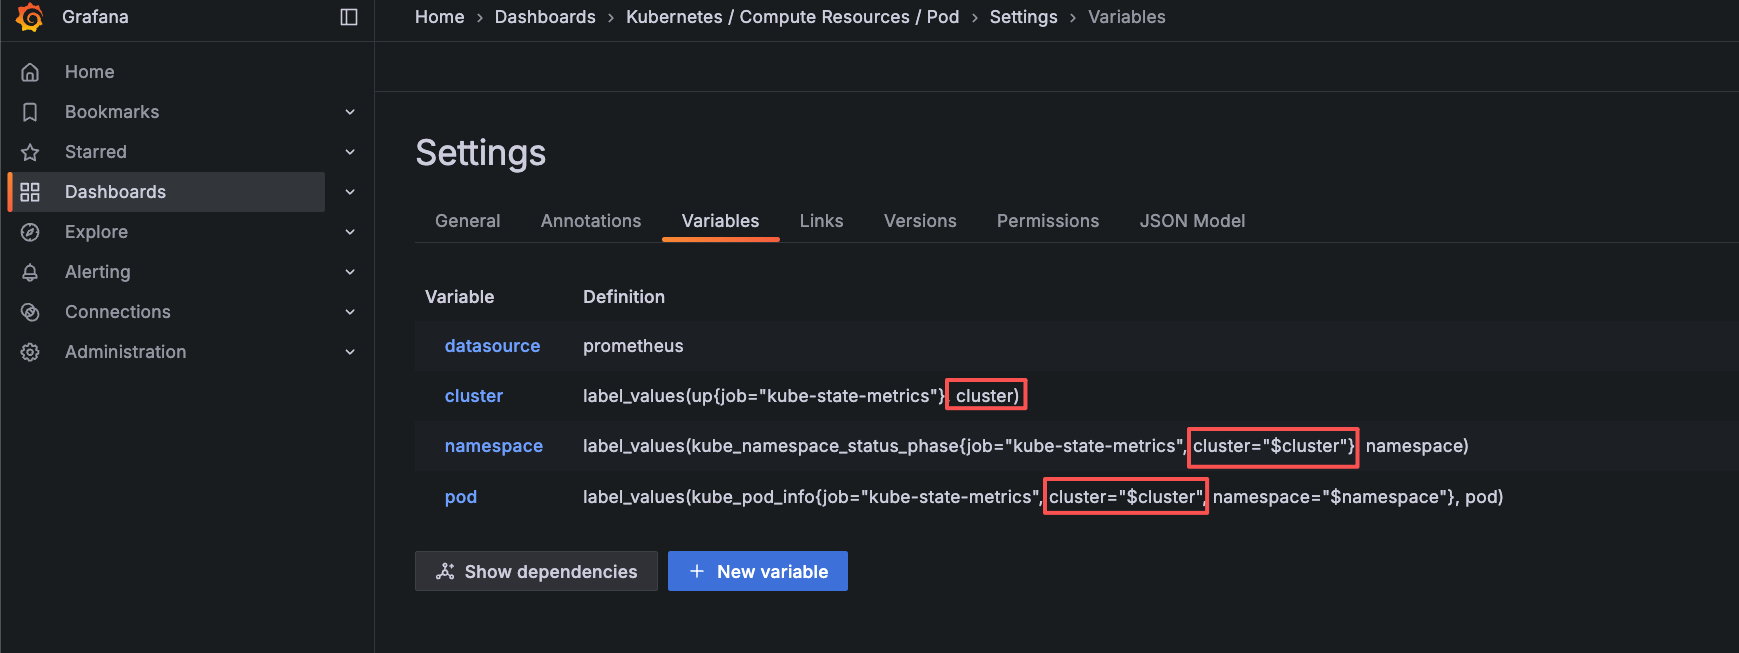
在单集群模式下,这个变量通常被隐藏,但隐藏并不意味着它不参与查询。Grafana 仍会解析变量,并把它放进 URL:
1 | var-cluster=test-k8s |
例如:
1 | # 正常情况下 var-cluster 应该为空 |
在 Prometheus 查询这类指标的来源
在 Prometheus 的 Status -> Configuration 中发现一个 job:
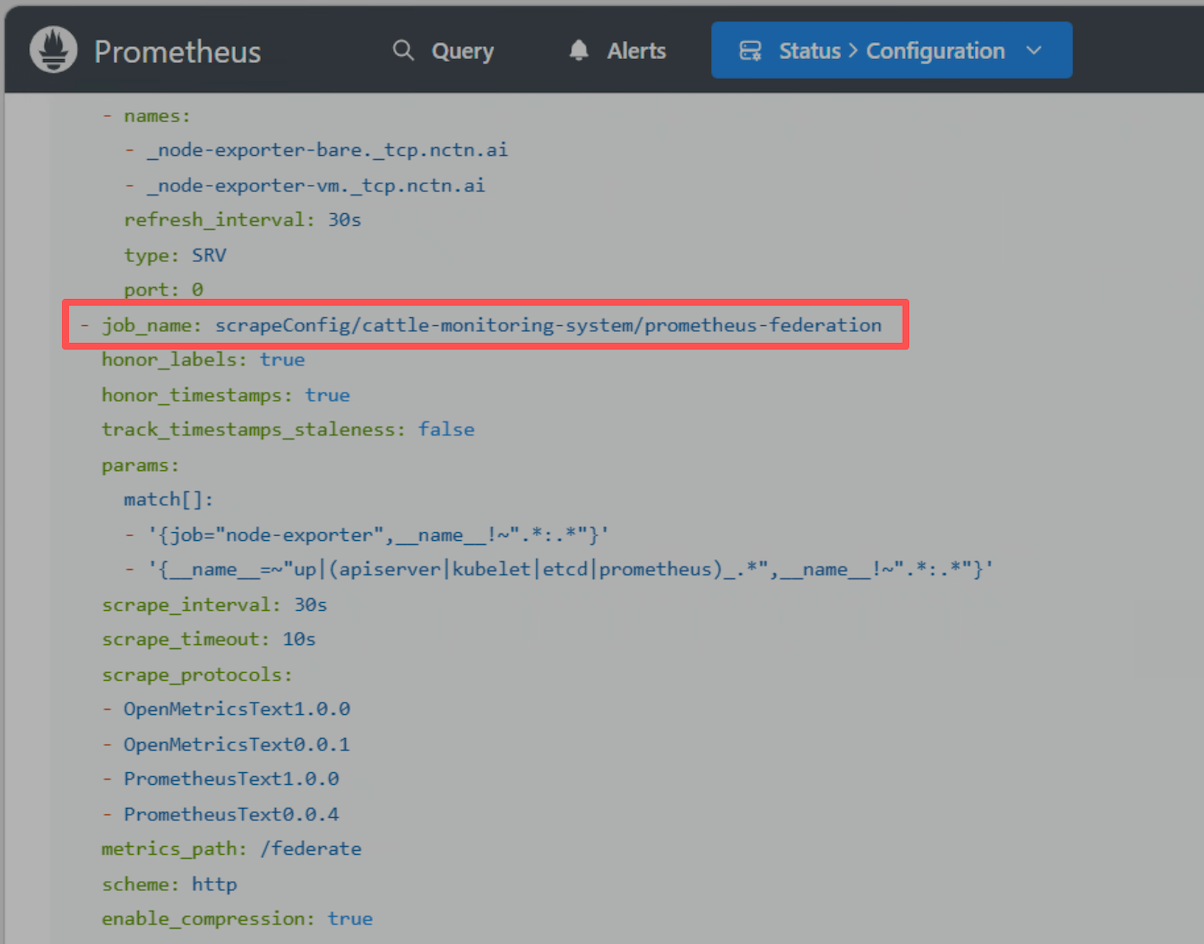
通过该 job 可以确认 local 集群通过 ScrapeConfig CR 获取外部数据,为 cattle-monitoring-system 下的 prometheus-federation。
该 ScrapeConfig 的具体规则为:
1 | - '{job="node-exporter",__name__!~".*:.*"}' |
说明该 ScrapeConfig 会获取 node-exporter、up 相关指标,以及 apiserver、kubelet、etcd、prometheus 开头的指标。
查看该 ScrapeConfig 对应其中一个集群的 Prometheus 发现配置了 externalLabels:
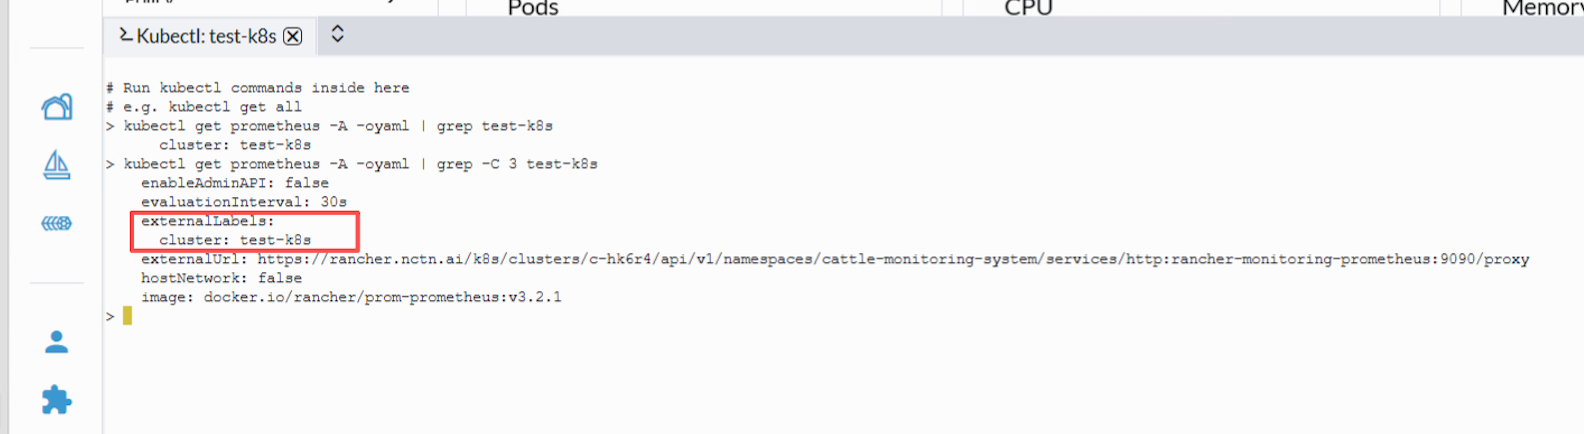
externalLabels 用于 Prometheus 与外部系统通信时为指标附加标签,它本身不是错误配置;问题在于 ScrapeConfig 把这些带标签的远端指标导入到了供单集群 Dashboard 使用的同一个 Prometheus 数据源中。
完整根因链路
1 | test-k8s Prometheus |
Workaround
方案一:配置 externalLabels
如果 cluster 标签没有实际用途,可以在 Prometheus 中去除对应的 externalLabels 配置,或者使用其他标签名。
方案二:配置 labeldrop
如果 cluster 标签对于远端 Prometheus 是必要的,对于 local 集群的 Prometheus 非必要,可以在 ScrapeConfig 中配置 labeldrop 去除 cluster 标签:
1 | spec: |
Rancher Monitoring Kubernetes Dashboard 显示 No Data 排查记录
https://warnerchen.github.io/2026/09/29/Rancher-Monitoring-Kubernetes-Dashboard-显示-No-Data-排查记录/